

The question of the pace and bounce of a cricket pitch has gnawed away at me (and a few other cricket analysts) for a very long time. The traditional appellation of “slow” pitches evokes ideas of a surface on which the pace of the ball towards the batter is lost upon pitching. How much does the data verify this? What really is the “bounce” of a pitch? I hope to jot down my preliminary explorations of these questions here.
At the outset, let me state that the “trueness” of a pitch is a related but different matter: it depends on the variance in the pace, turn, and bounce, especially within one game or innings. Here, I will talk mostly about mean values of “pace” and “bounce” and how the perception of a pitch relates to these.
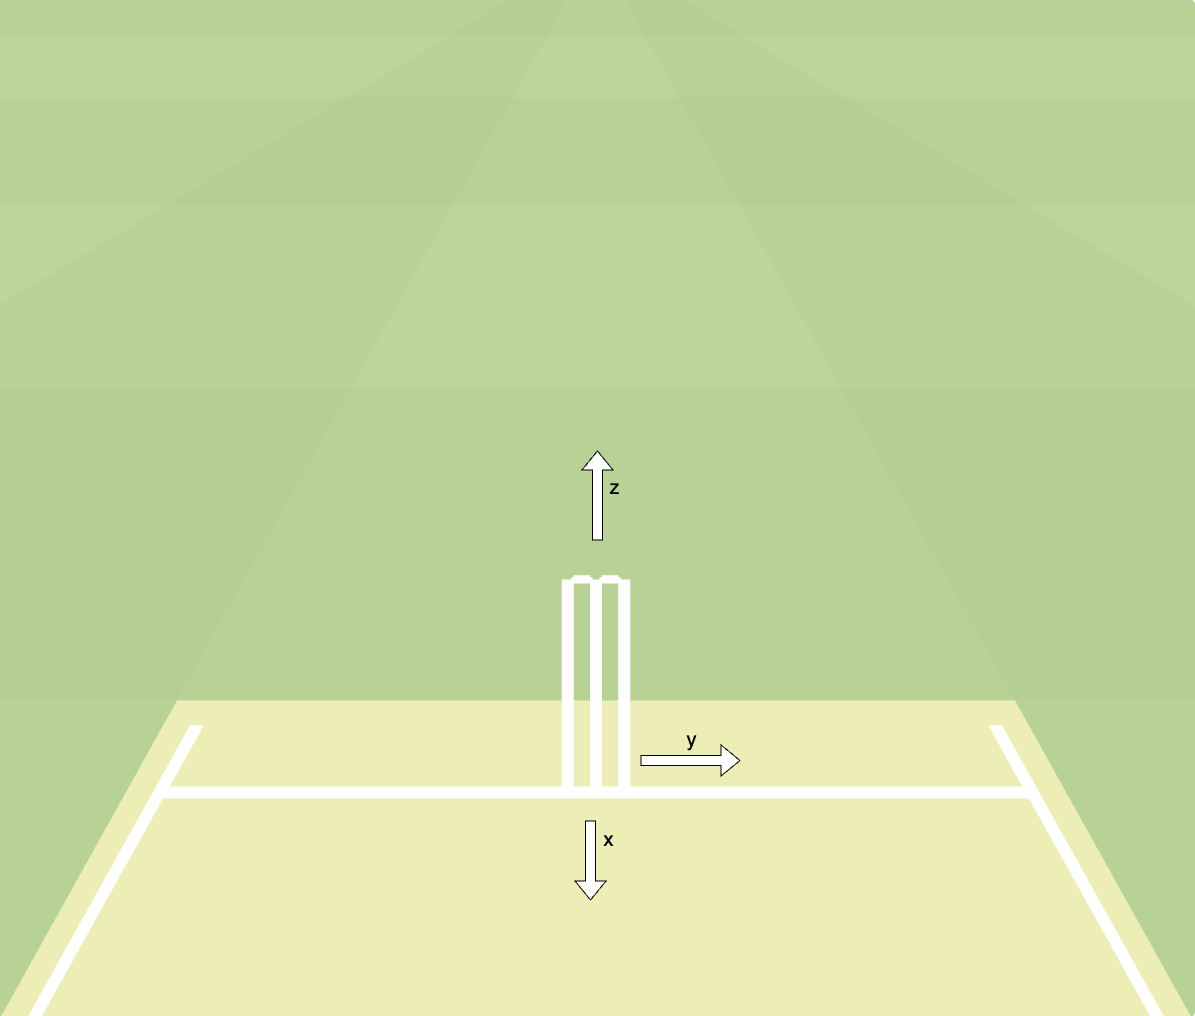
First, a few definitions. Below is a picture of the cricket pitch seen from front-on with three axes. The x-axis goes down the pitch, the y-axis goes across the pitch (y increases from left to right from the umpire’s persepctive), and the z-axis is height.
We have information about the ball’s velocity right before and right after bouncing. I will be using the terms vx0, vy0, vz0 to denote the three components of pre-bounce velocity, and vx1, vy1, vz1 to denote the corresponding post-bounce values. First, we have the coefficient of restitution (COR), the ratio of the post-to-pre-bounce z-velocity:

This just tells us how much vertical velocity a ball retains upon pitching. For the velocity loss in the x- and y-directions, we have the corresponding quantity which I name COX: the ratio of post-to-pre velocities along the pre-bounce line of the ball. For simplicity, assume that the ball has no change in y-velocity (no seam movement or turn). Then,

Our actual definition of COX will involve both x and y velocities, and keep the fraction of speed along the ball’s pitching line. COX tells you how much speed is retained in the direction along the pitch.
So we have the pair of COR and COX, which tell us about the fraction of velocity retained along the vertical direction and in the x-y plane (forward and sideways). Another useful quantity is the ratio of angles post-and-pre-bounce:

This just tells us the steepness of the bounce relative to the angle at which the ball drops to the ground. In terms of the velocities (again assuming v_y = 0 for simplicity), we have

The above fraction is approximately equal to (vz1/vz0) / (vz1/vx0), which of course is COR/COX. This shows that the steepness of bounce on a pitch is a combination of both forward pace and vertical pace.
You can get steep bounce by either high COR or low COX. Both cases will lead to high bounce, and this makes sense. Imagine a pitch A on which the ball loses more forward pace than on pitch B. The ball takes a longer time to reach the crease on A, rising more than on pitch B by the time the batter makes contact. Although pitch A has lost more pace, the batter perceives pitch A to have more “bounce”, even if the COR (vertical speed) on both pitches is the same. The height at which the ball reaches the stumps depends on the post-bounce angle and not the forward or vertical speeds alone.
Now let’s have a look at pitches in different countries, considering only pace balls faster than 128 kmph. Our analysis will be restricted to these, since both slower balls and spinning balls live in an entirely different regime, needing slightly different surface contact physics.
Below, I plot the average angle ratio (x axis) and the average fraction of speed lost upon pitching (y axis), for 5-10m length pace balls. Both these quantities are related to the length, but I confirmed that restricting to different length bands within the 5-10m region also gives similar results.
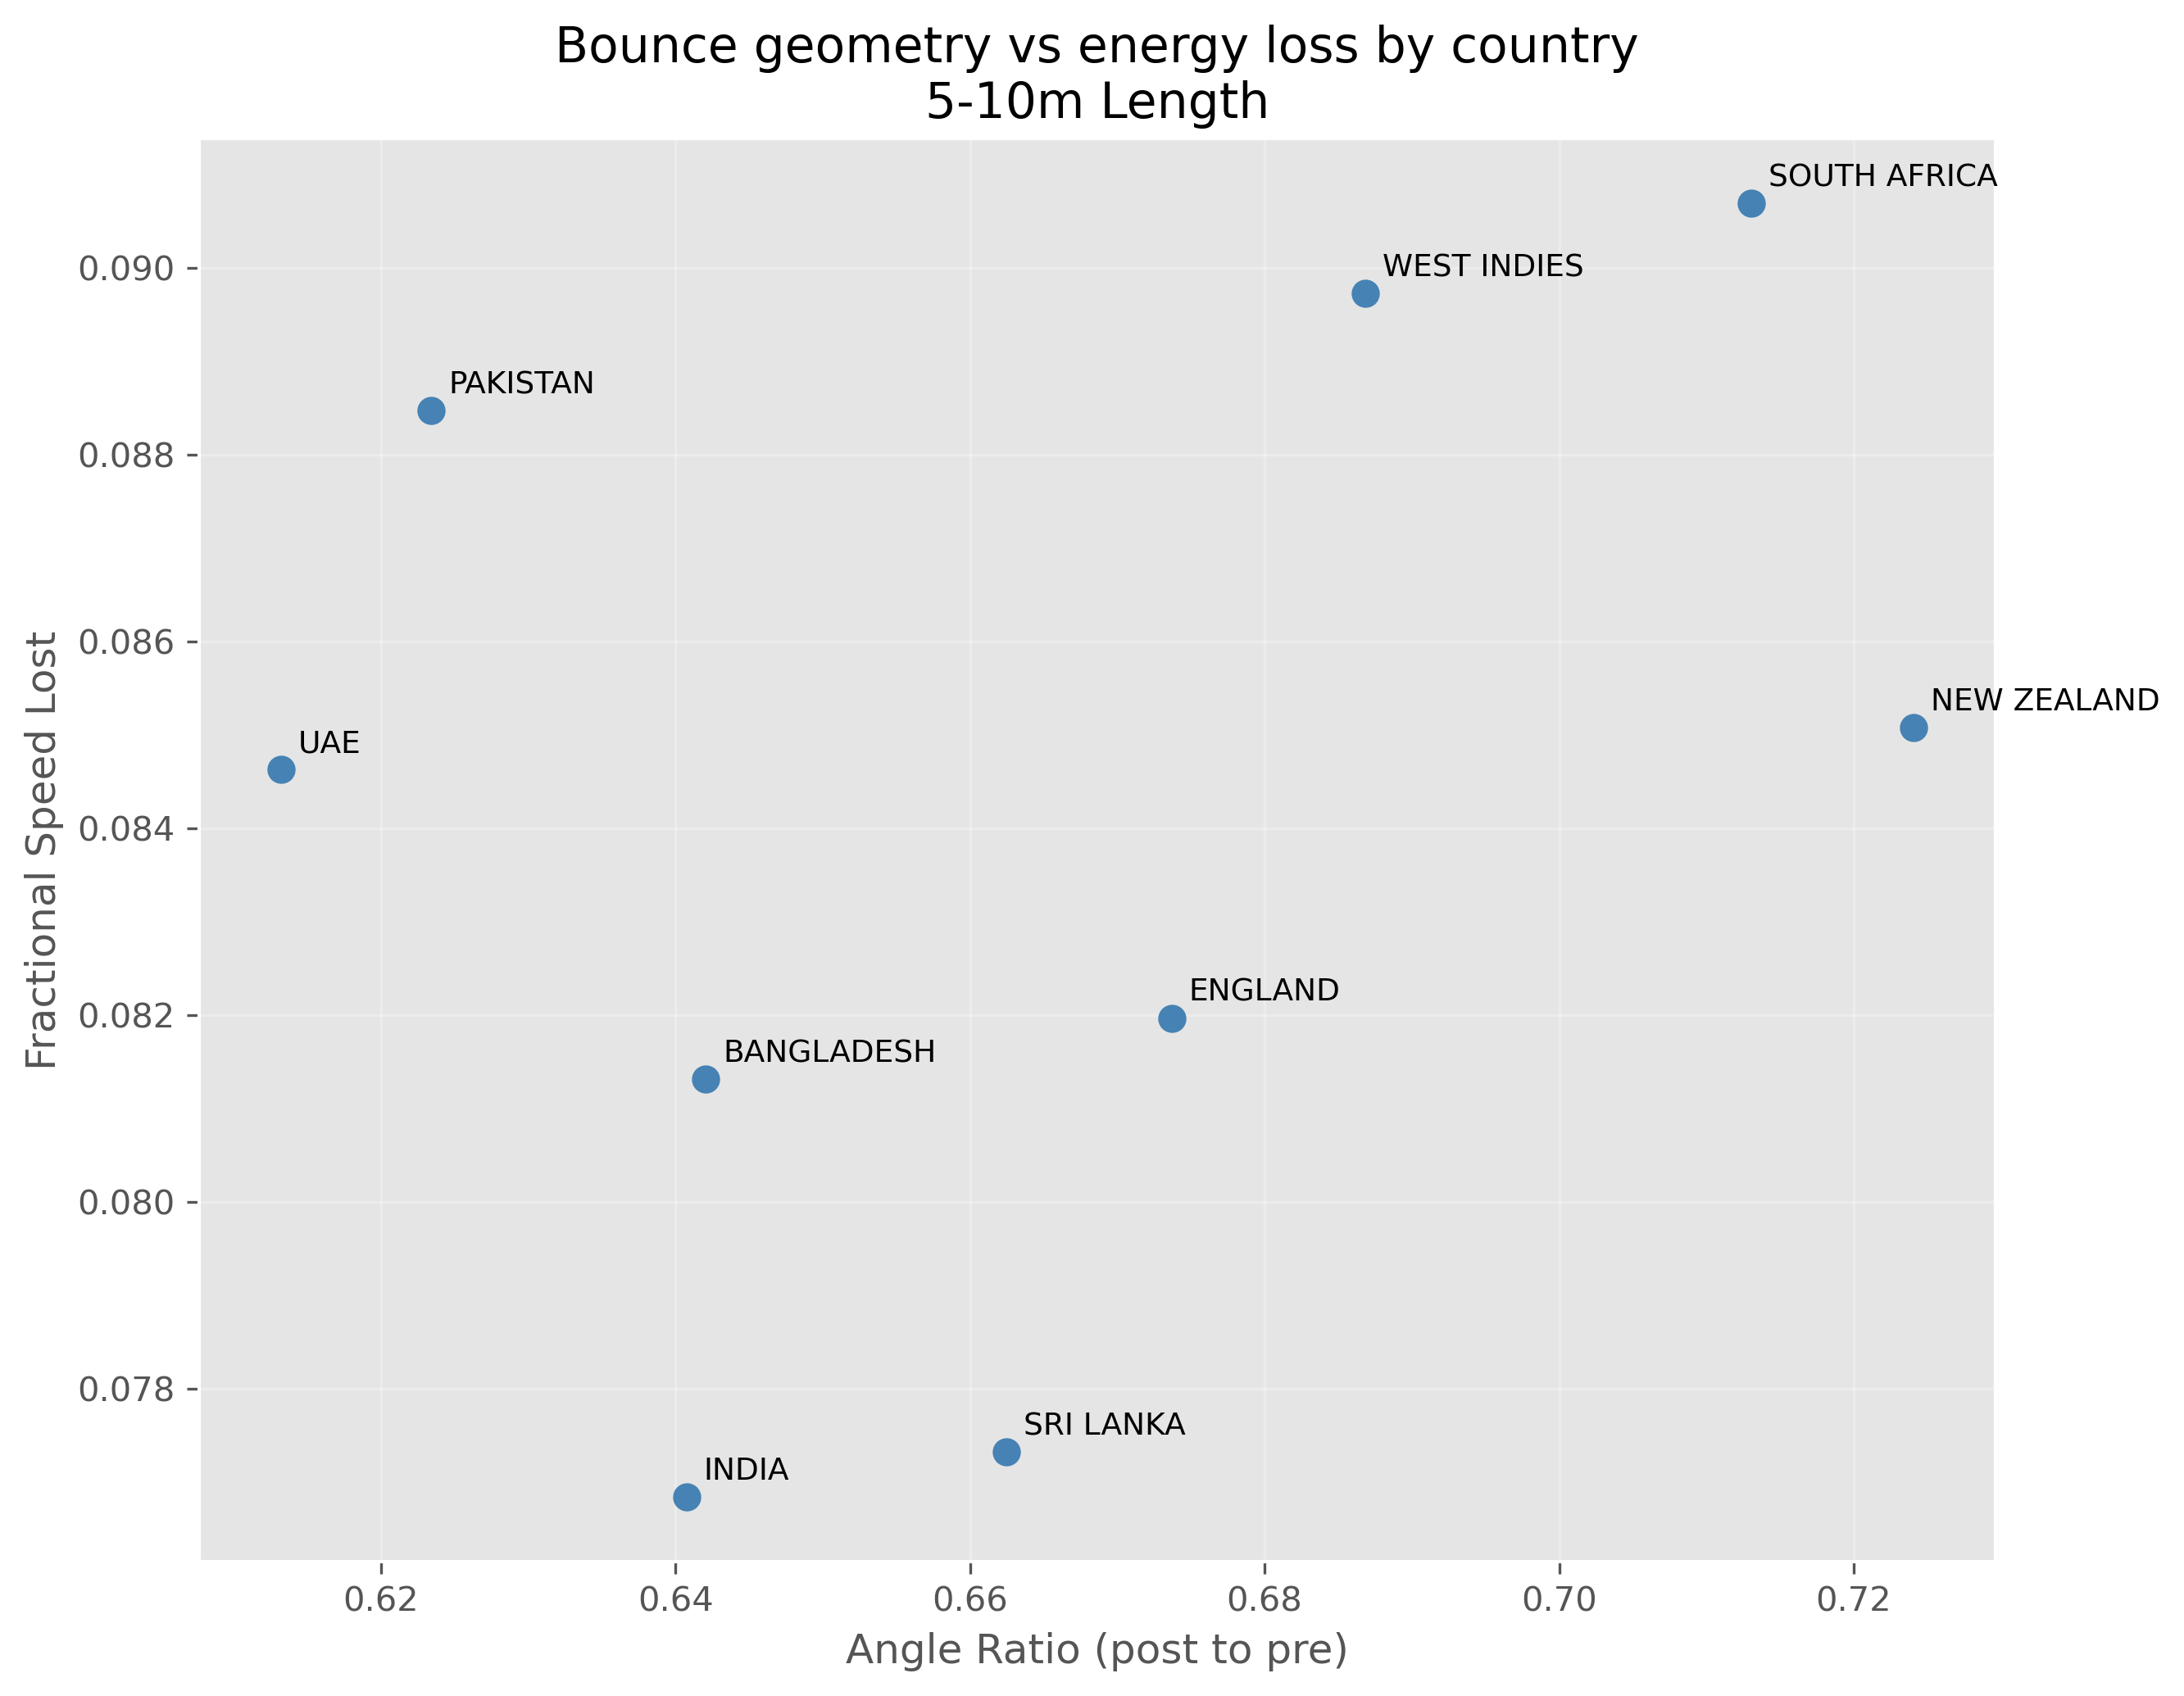
We can see three (excluding England) distinct clusters here. At the top right we have the “pace friendly” countries: NZ, SA, WI. They have a high angle ratios: the ball bounces steeply here. In contrast, the 5 Asian venues have low angle ratios — low bounce. The surprising revelation is on the y-axis. It is seen that the high-bounce countries lose the most pace off the pitch. This is highly counterintuitive to the colloquial labeling of these pitches. They are supposed to be “fast” and “quick”, but the data points us in the opposite direction. The “harder” surfaces outside Asia and England absorb more energy from the ball and bounce higher. In fact these two phenomena are related (more on that later). Finally, we see UAE and Pak live in their own little cluster: they lose a lot of pace and have low bounce angles — truly “low and slow”.
Let’s now break the angle ratio apart into COR and COX. First, here are the distributions of both:
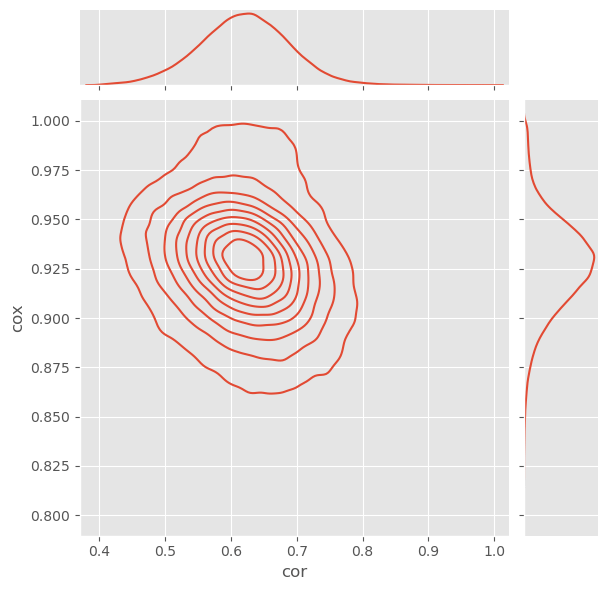
You’ll notice that COR has a much larger range than COX — it varies from 0.5 to 0.8, whereas COX varies from 0.875 to 0.975. We can reason that the variation of COR is a bigger driver in the variation of angle ratio.
COR and COX are not exactly independent of the incoming speed. After all, a ball that bangs harder into the pitch elicits a harder response. This is shown in the next two plots, where I have shown the mean COR and COX (normalised by the population COR and COX) in bins of vz0 (rightward is lower speed).
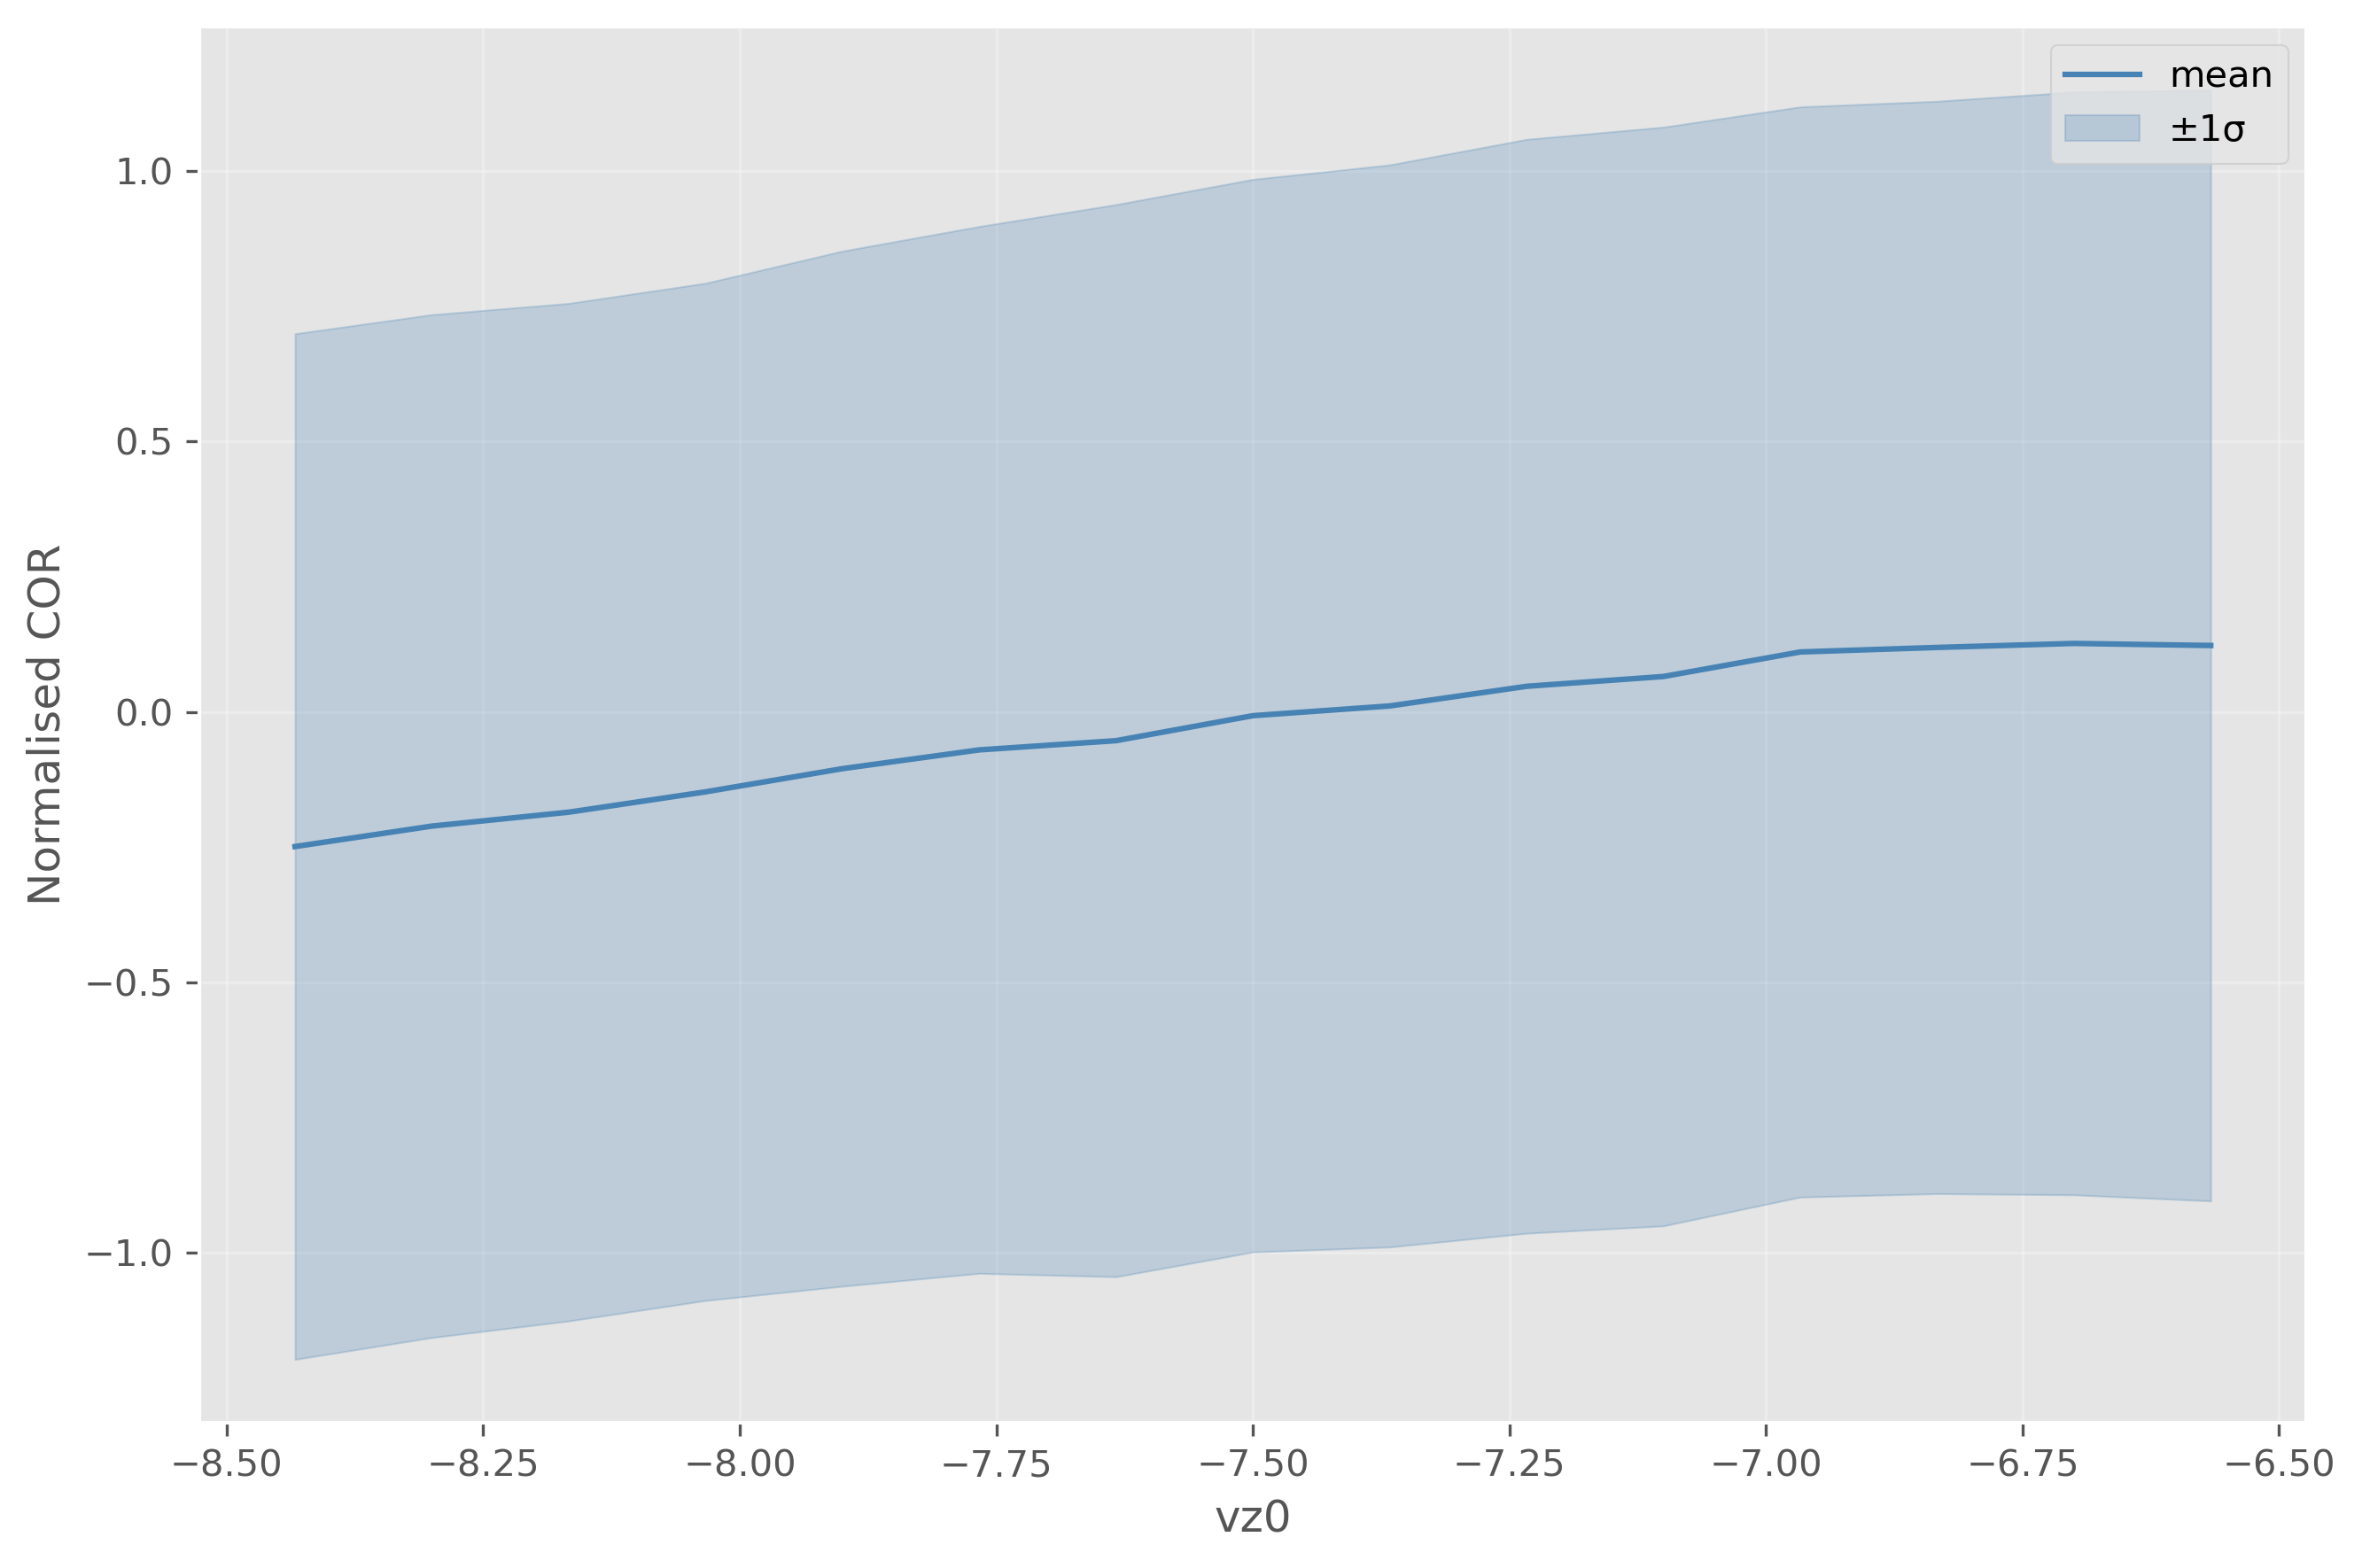
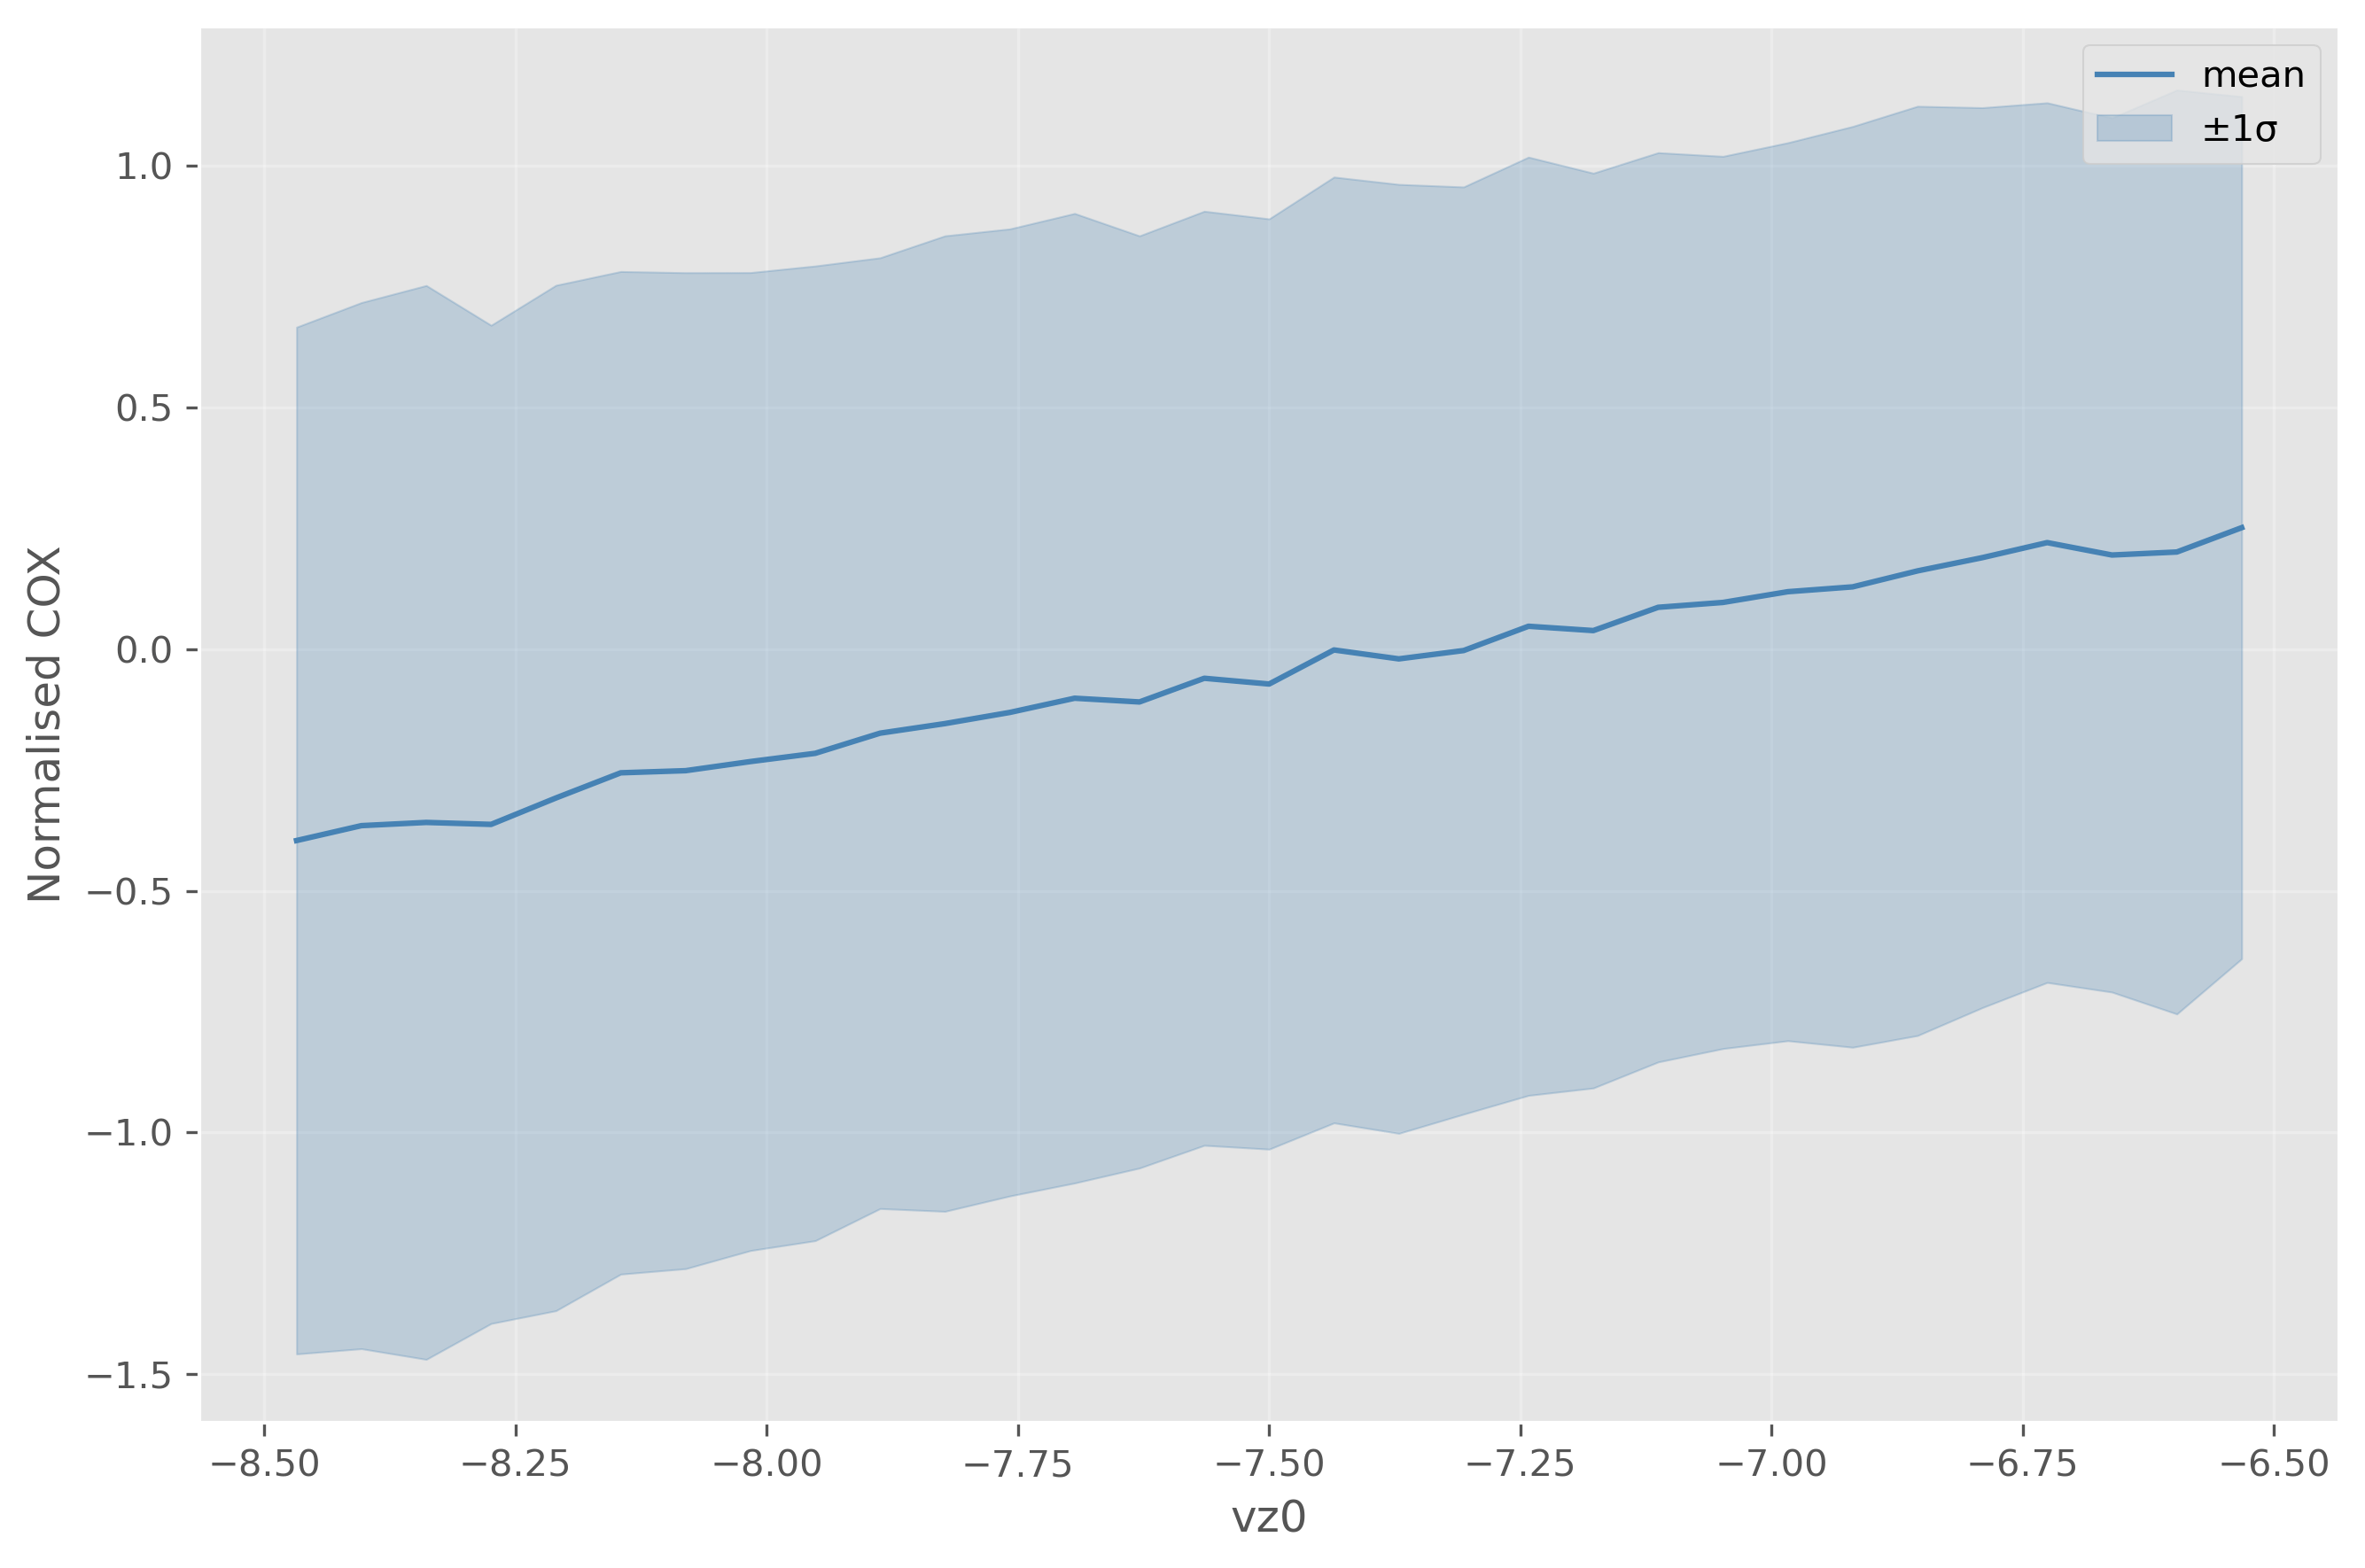
The direction of the curves makes sense: banging the ball harder into the surface leads to a lower relative retention of speed. However, the variation is not very steep for either. They both move about 0.4 σ for a wide range of vz0. Nevertheless, let’s restrict ourselves to the 6-8 m length band and plot the mean COR and COX in different countries:
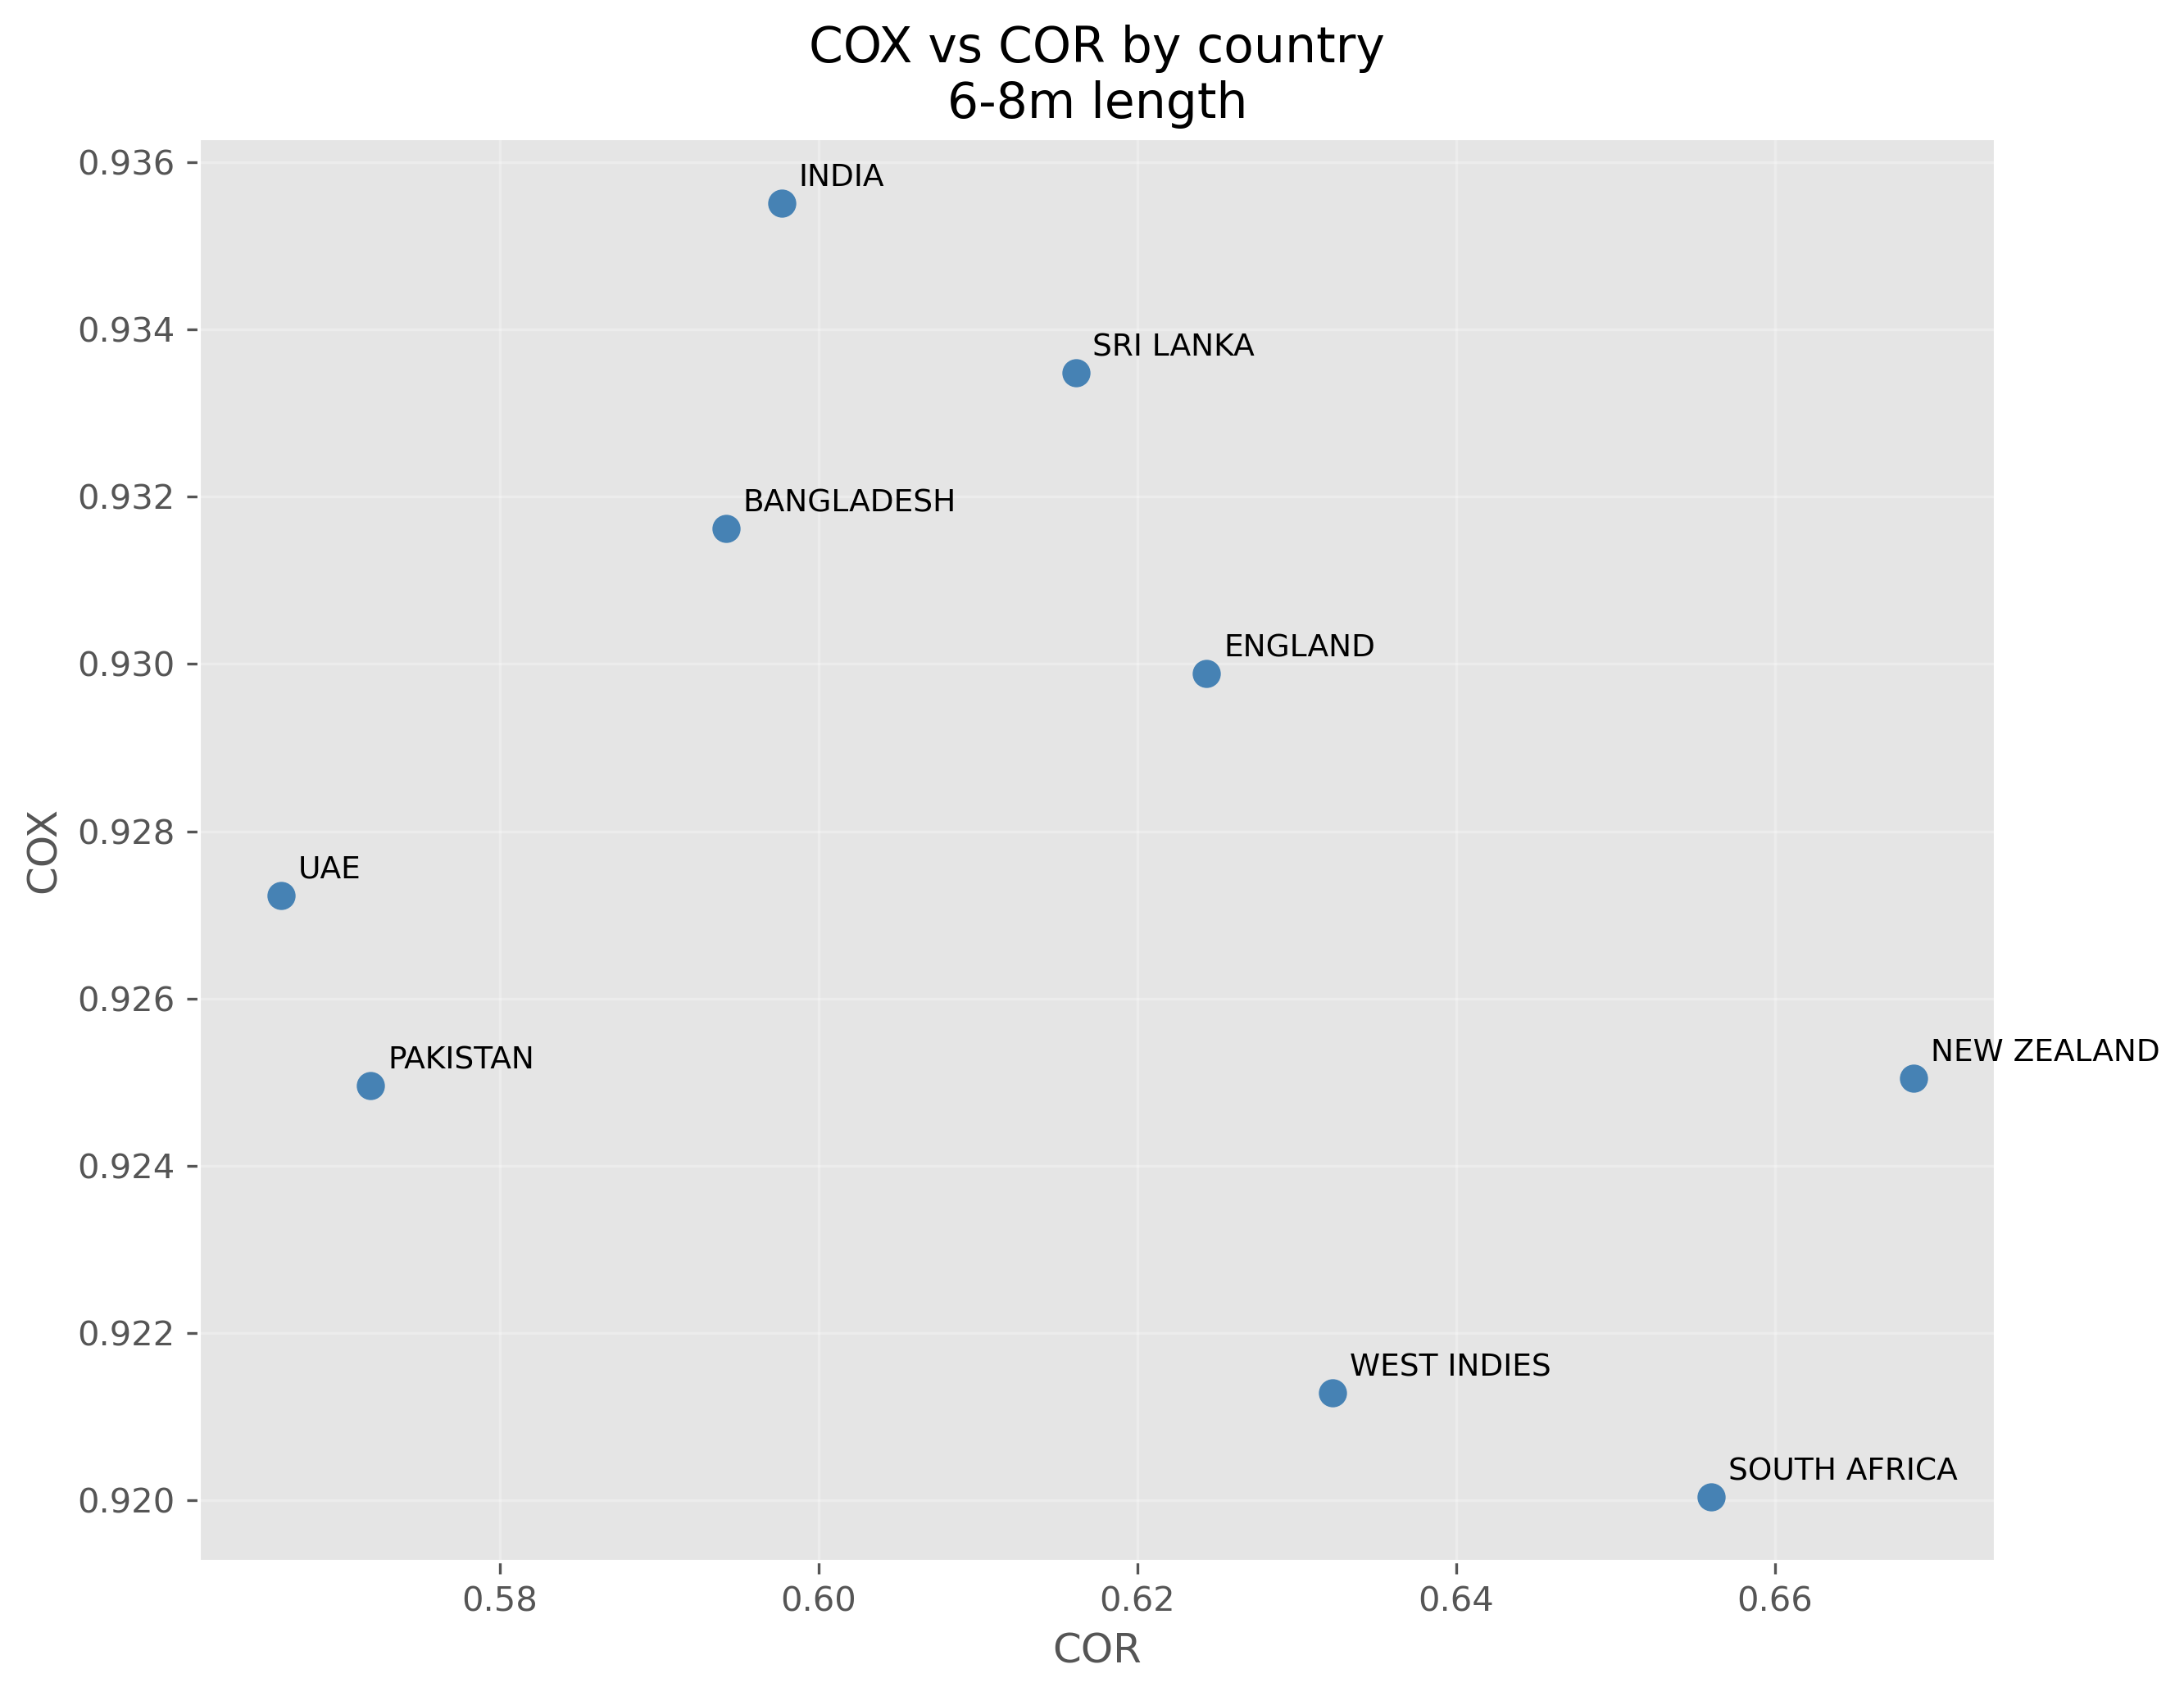
Again, we see the same pattern and the same clustering. NZ, SA, WI are the “fast” countries: they show high vertical speed retention (high COR) but also show low COX (high amount of forward speed lost). Ind, SL, Ban lie in their own cluster close to UK, with lower COR (lower than the full set mean) and high pace retention. UAE and Pak lie at very low COR and low COX — again truly low and slow.
The remarkable thing in the above plot is the loose negative correlation: high COR correlates with low COX. Pitches that absorb more vertical velocity absorb less forward velocity. From a surface physics perspective, this makes sense. On harder pitches, the ball rebounds more vertically, the change in vertical velocity is higher. A ball that falls at 8 m/s and rebounds at 6 m/s changes speed by 14 m/s, with a COR of 0.75. If the same ball rebounds at 5 m/s, the change is lower (13 m/s) with a COR of 0.625. A higher COR means a greater change in vertical speed, which means longer contact with the pitch. In physics terms, a higher COR implies a larger normal impulse. This larger normal impulse means that the frictional impulse is higher, robbing the ball of more of its forward speed (remember that Friction Force is proportional to Normal Force; higher normal force = more friction = more loss of forward speed).
So, a harder pitch leads to higher bounce (the ball reaching the batter higher) in three correlated ways:
The COR is higher — the ball retains more of its vertical speed
The COX is lower (weakly correlated) — the ball loses more of its forward speed
And, in combination, the post-bounce angle (COR/COX) increases due to both of the above, leading to a greater height at the crease.
So, contrary to perception, pitches in NZ/WI/SA lose more pace in the forward direction than Asian pitches. They also have higher vertical speed retention. Both these come together to make the ball reach the batter higher. It is this perception that is called the “bounciness” of a pitch.
We can quantify this with solid data. The average pace-on ball landing close to the 7m mark reaches the pitching point at a forward speed of 34.28 m/s (vx0) and a downward speed of 7.26 m/s (vz0). For a fixed length, we can assume that COR and COX are independent, COR is independent of vz0, and COX is independent of vx0. With the trajectory equations (below), we can plot the trajectory of the post-bounce path for any COX and COR values.

where all v_i and a_i are post-bounce values. a_x is set to the median value in the set, a_y = 0 (no swing after bounce). We obtain v_x1 = v_x = v_x0 COX and v_z1 = v_z = v_z0 COR for computing the trajectory using the equations.
We plot the projected height at the stumps and the time to stumps from pitching, vs the normalised COX ([COX - Mean COX] / Std(COX)).
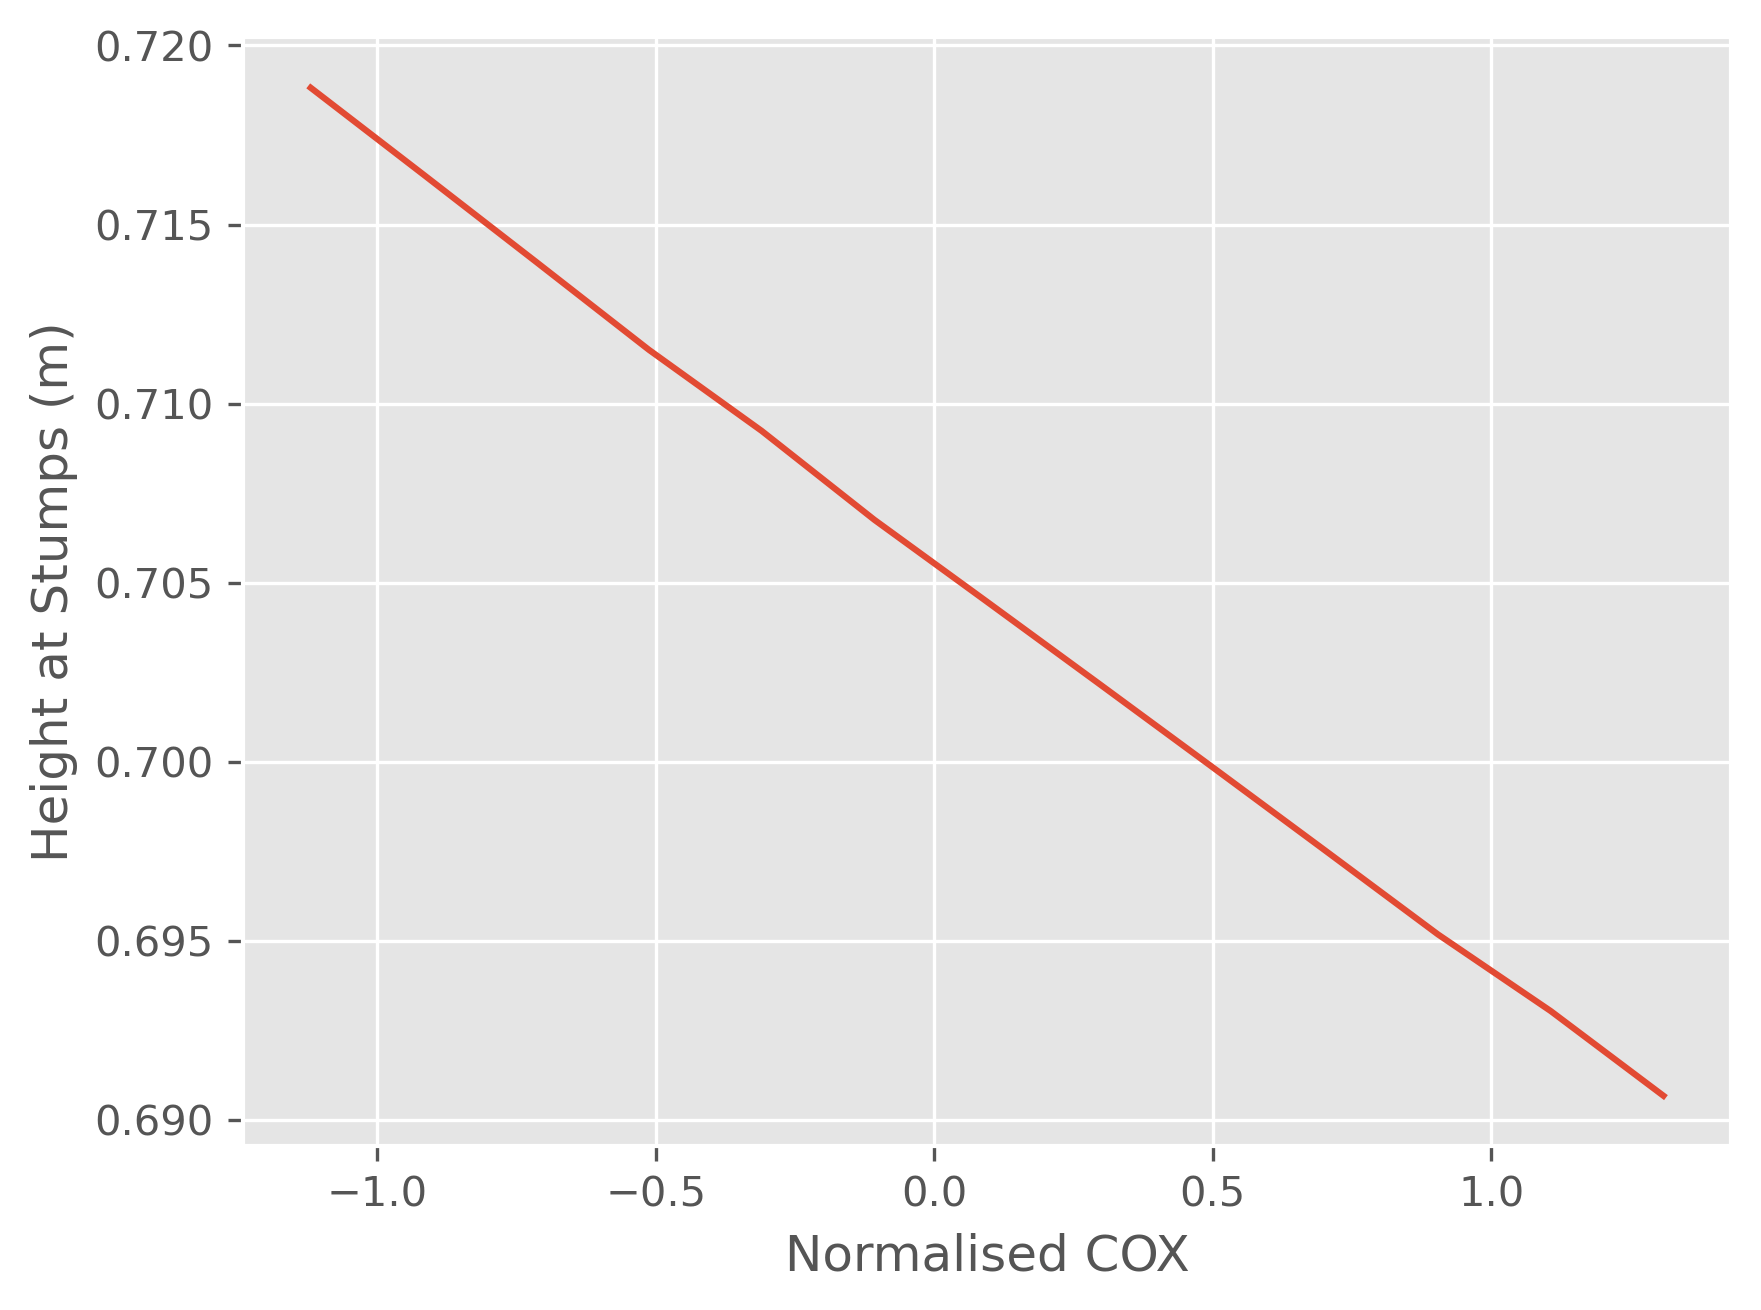
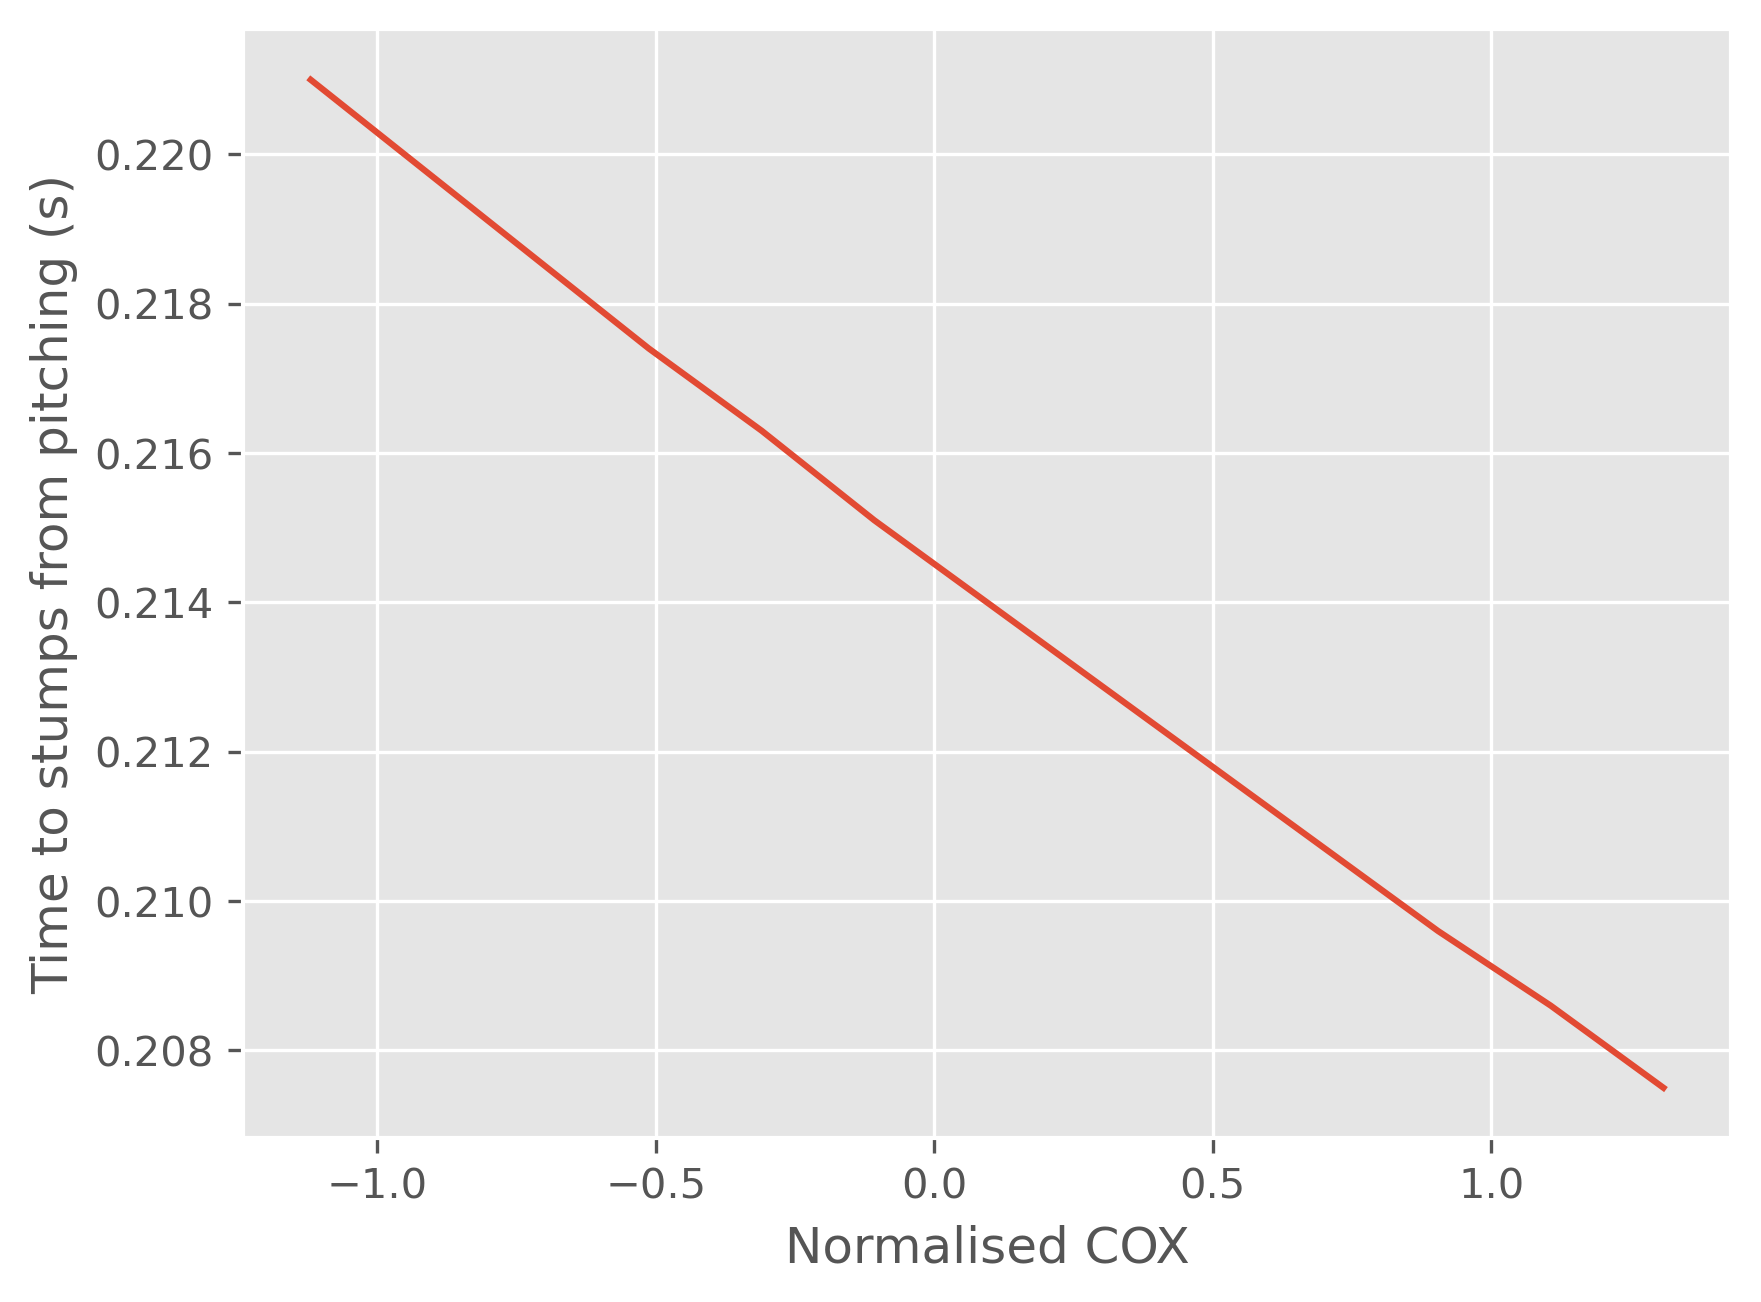
Two things to see here:
A 2σ variation in COX changes the projected height by less than 3 cm.
The same 2σ variation in COX changes the time to stumps by a mere 0.02s.
Let’s see the projected height plot for COR (the time to stumps is independent of COR):
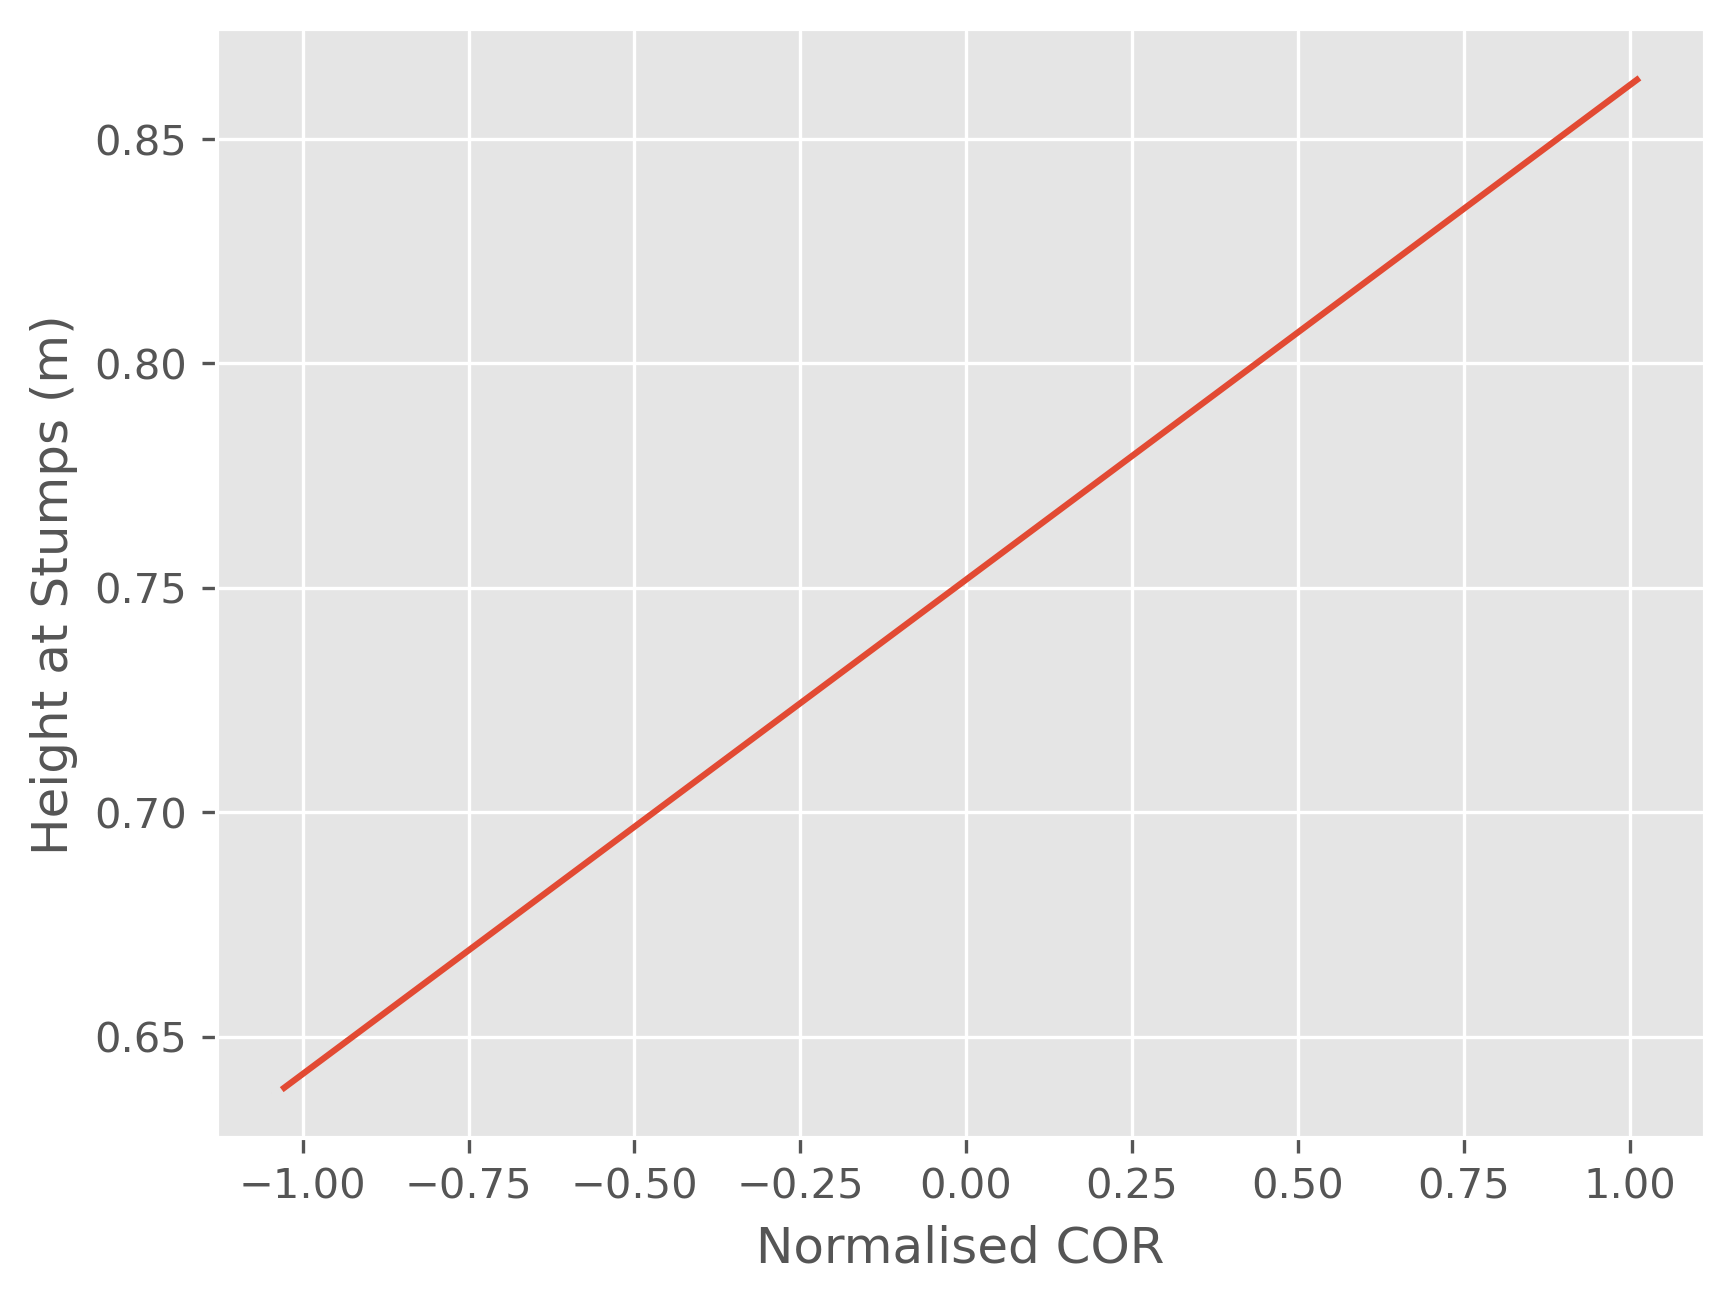
A 2σ variation in COR produces a whopping 20cm difference in the height at stumps.
COR (vertical speed) is the predominant driver of where the batter sees the ball approach them. Fast pitches (NZ/SA/WI) make the ball lose a lot of its forward speed. They are not “fast” in the usual sense. But the same mechanism drives these pitches to kick the ball higher vertically. Crucially, both these effects work to increase the height of the ball.
My sense is that this “perception of bounce” is called the “quickness” of a pitch. A “fast” pitch is a bouncy pitch, a “slow” pitch is a low pitch.
There’s much else to be done in this regard, but I cannot go into deeper detail in a public post. I will end this piece with a plot of the projected height at the stumps and the time taken to reach the stumps on the "average pitch” in different countries:
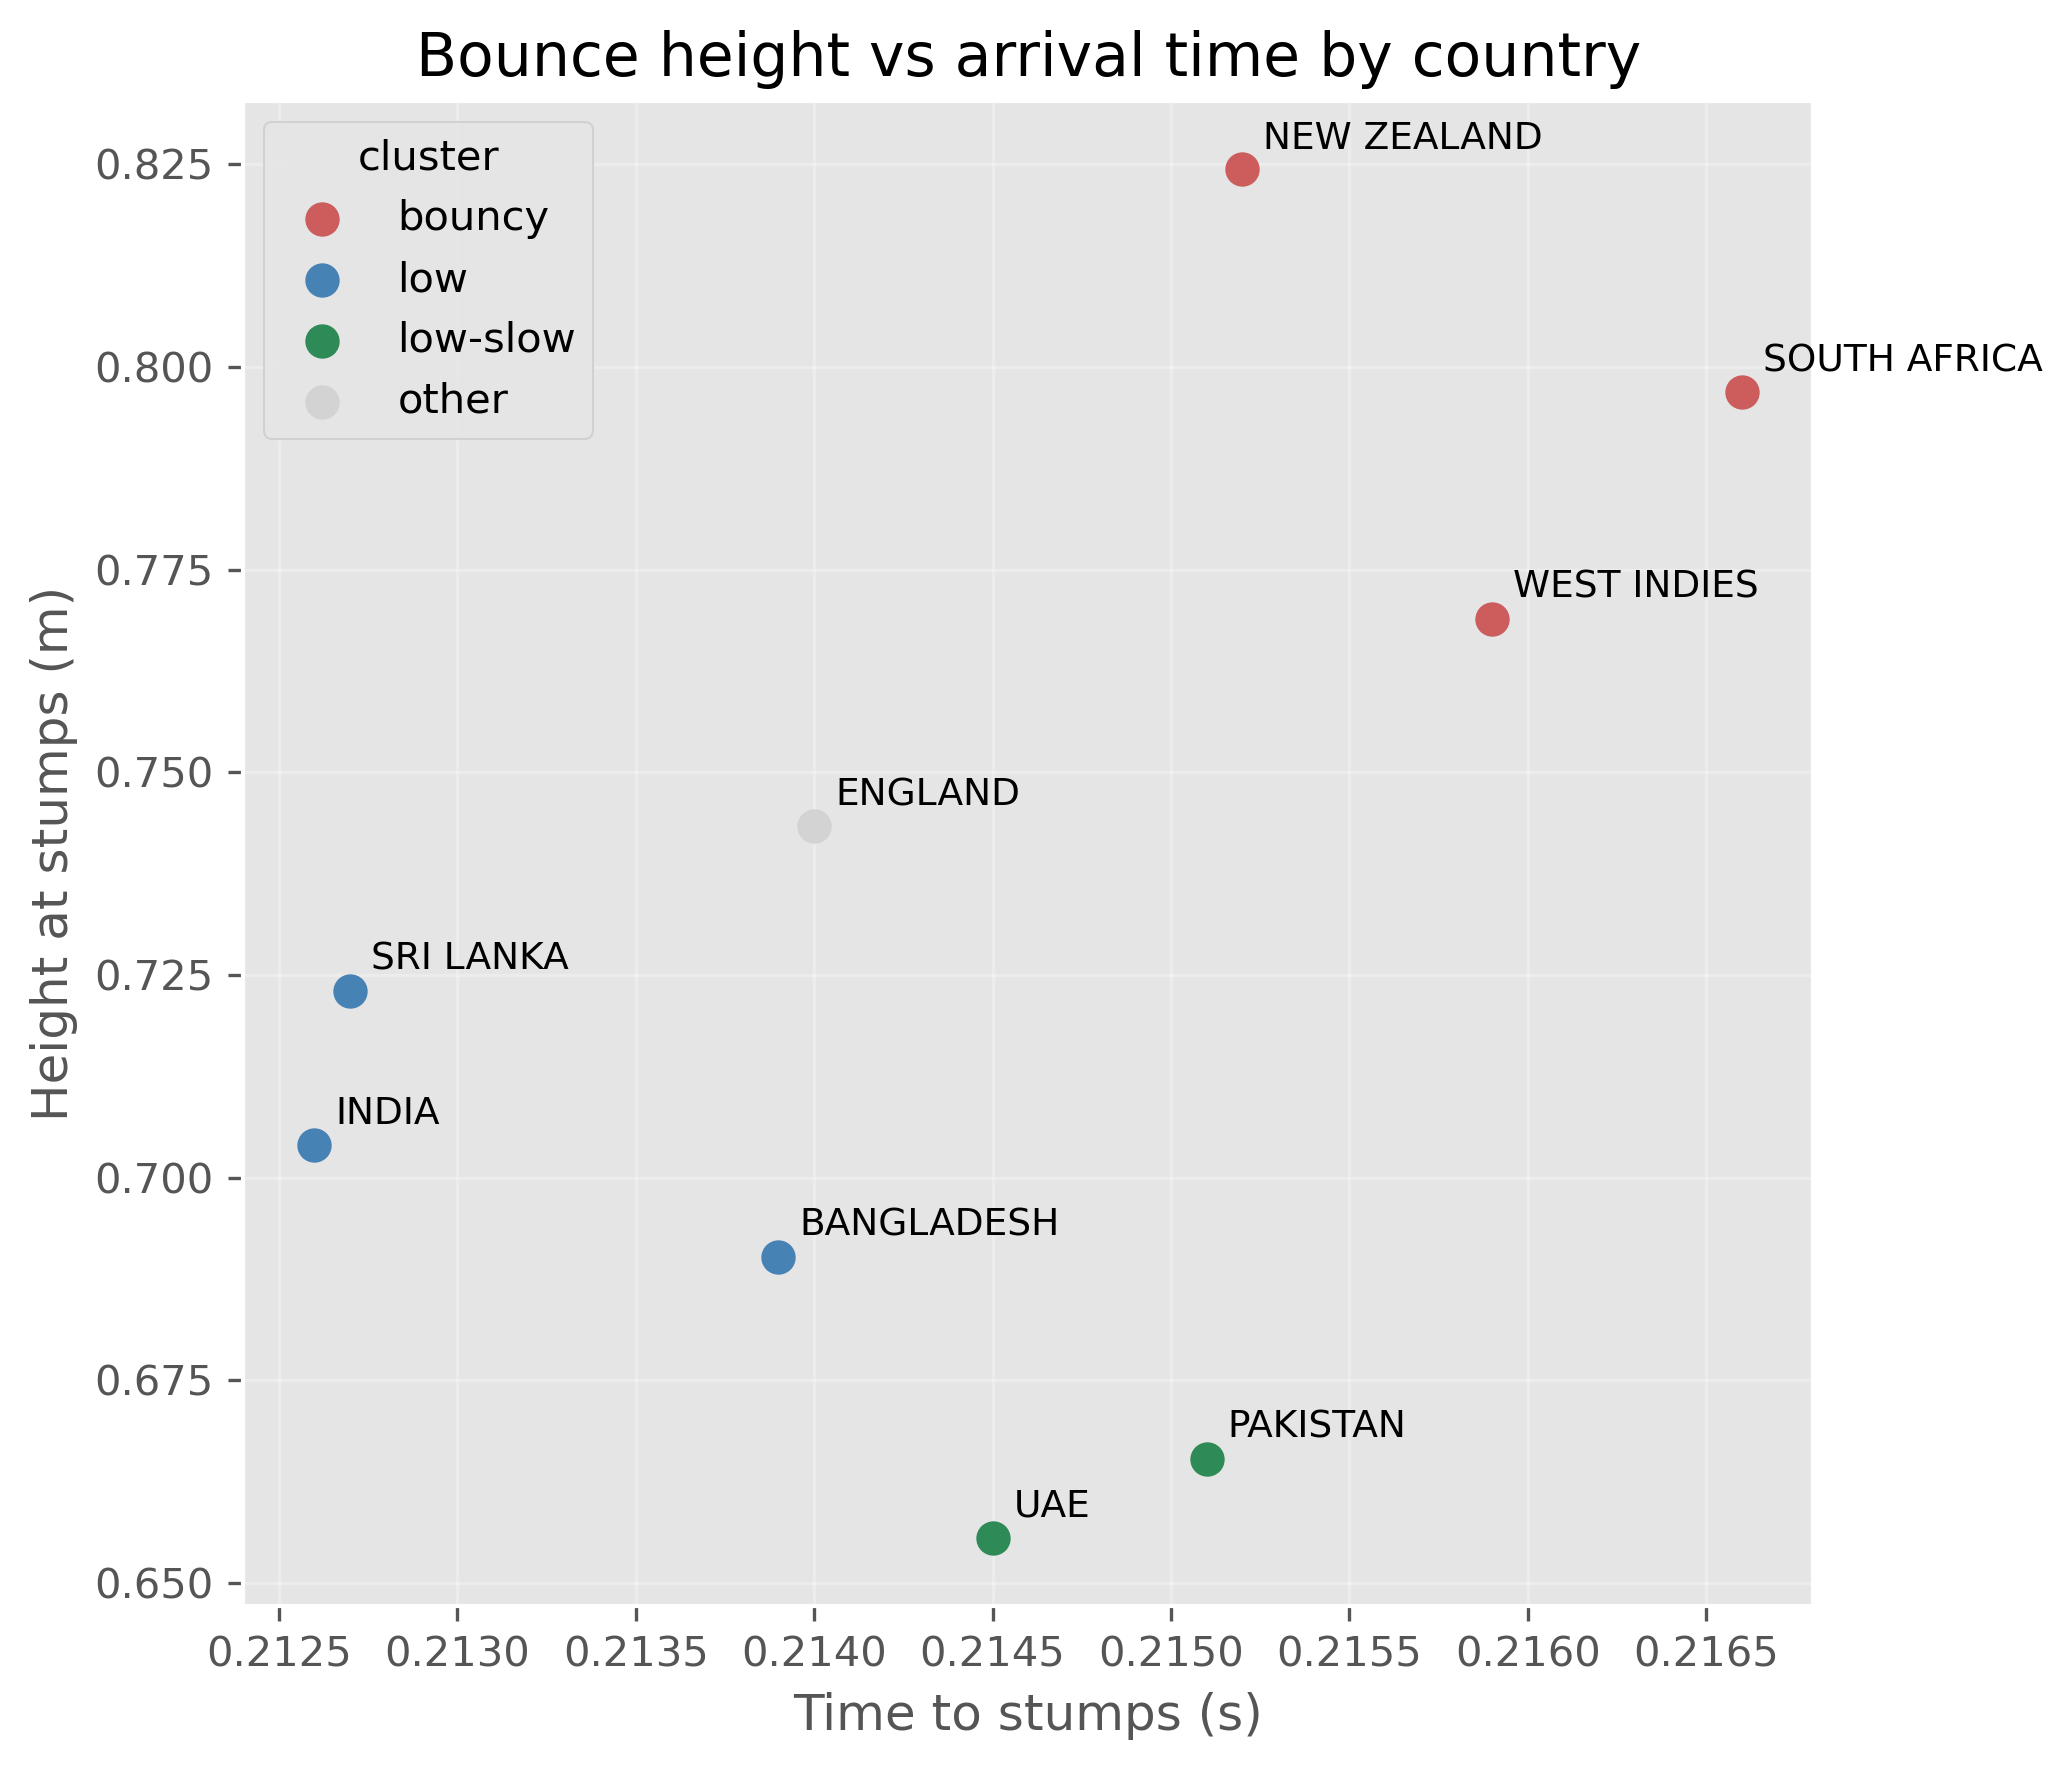
We have three distinct clusters, with England sitting somewhere in the middle of everything.
The “bouncy” countries: pace-friendly (SA/NZ/WI), high height at stumps, longest time to get there;
The “low” countries: Ind/Ban/SL, the ball arrives at a ~5cm lower height than in the “bouncy” cluster. The ball arrives about 0.004 s faster.
The “slow-low” countries: Pak/UAE, where the ball arrives 15 cm lower than in the bouncy countries, but also takes a bit of time to arrive.
Conclusion
A “slow” pitch is mostly a low pitch. The final plot above demonstrates that between pitches which lose a lot of forward pace and those that do not, the reaction time-difference for a batter is a measly 0.004 s. Now, the actual reaction times will have a spread, but this small a variation is not perceptible or actionable for humans. This leads me to conclude that it is not the time, but the height at which the ball arrives, which determines how “fast” a pitch is to a batter. A few points:
Pitches show a much greater variation in stumps height than in the time-to-stumps. A 5cm difference in height is the difference between a thick edge and a nick that goes to the keeper. A 0.01s difference in reaction time is mostly imperceptible.
The bat comes in a natural downward motion, which means adjusting to height variation is extremely difficult. My conjecture is that a “lower” pitch means the ball is met at a closer trajectory to the downward swing, making it appear “easier” or “not quick”. High bounce pitches demand adjustment, or quicker reactions, giving them the “quick”moniker.
Another conjecture is that pitches with higher stumps height make the ball hit the bat higher, jarring it more, making it feel “heavier”, giving the impression that the ball loses less pace.
There is much confusion among cricket parlance about the character of a pitch. This is a preliminary investigation into a thorny and deep question: what makes a “fast” pitch? This question will need more research in the coming years if people are willing to do it. But for now, I believe that a low-bounce pitch is often called “slow”, and the simple definition of a pitch losing lower pace in the forward direction does not hold for traditionally labelled “fast” pitches.
This is fascinating man. But, I've got a possibly dumb question (considering my formal science training ended in high school!). You mentioned 128 kph as the lower bound because the science changes below that number. I was wondering how you determined 128? Is it a number where you saw inexplicable changes within these formulas, or was it just a gut feel number?
I ask because I've been thinking about the upcoming Women's World Cup in England, where "express" pace is in the 120+ kph range. I was wondering what we can expect on these pitches at that pace, especially considering that England seems to be this interesting outlier nation in your 128+ kph data?
Interesting analysis - I'd imagine Australia's pitches are in the SA WI cluster, I didn't see them in any of the graphs. You mentioned spin having different surface physics, and I can see how comparing topspinner, leg/off break, and flipper would be inconvenient for using this COR method for all spin deliveries - would it be better to compare the charts for spin deliveries if the delivery type is known? I'm curious to see how spin deliveries interact with the pitches compared to pace.
Also, sir, hats off to your ball-by-ball dataset! Discovered it a few days ago, and I can't stop playing around with it! :)