
New access to ball tracking data in cricket can help us decompose the act of the spinner’s delivery turning off the pitch into its constituent parts, and help us ascertain the “turn” in different pitches along the way. This note is a preliminary exploration of some of these topics, furnishing a turn ranking for different Test match pitches at the end.
The Basics: Defining Impulses on the Turning Ball
To start, some bookkeeping. Below is the trajectory of a spinning delivery (Ashwin to Pooran in the 2024 IPL). The ball leaves the hand at some angle across the pitch. This angle changes due to drift in the air before the ball pitches. Upon pitching, interaction with the pitch and the revs on the ball make it turn away from the line before bouncing. In terms of physics, the ball has received an “impulse” from the act of bouncing on the pitch, which is technical terminology for getting a change in speed due to some force. This impulse changes the line of the ball, as can be seen from the top-view of the pitch here. It also changes the vertical speed of the ball, which is not discernible from this view.
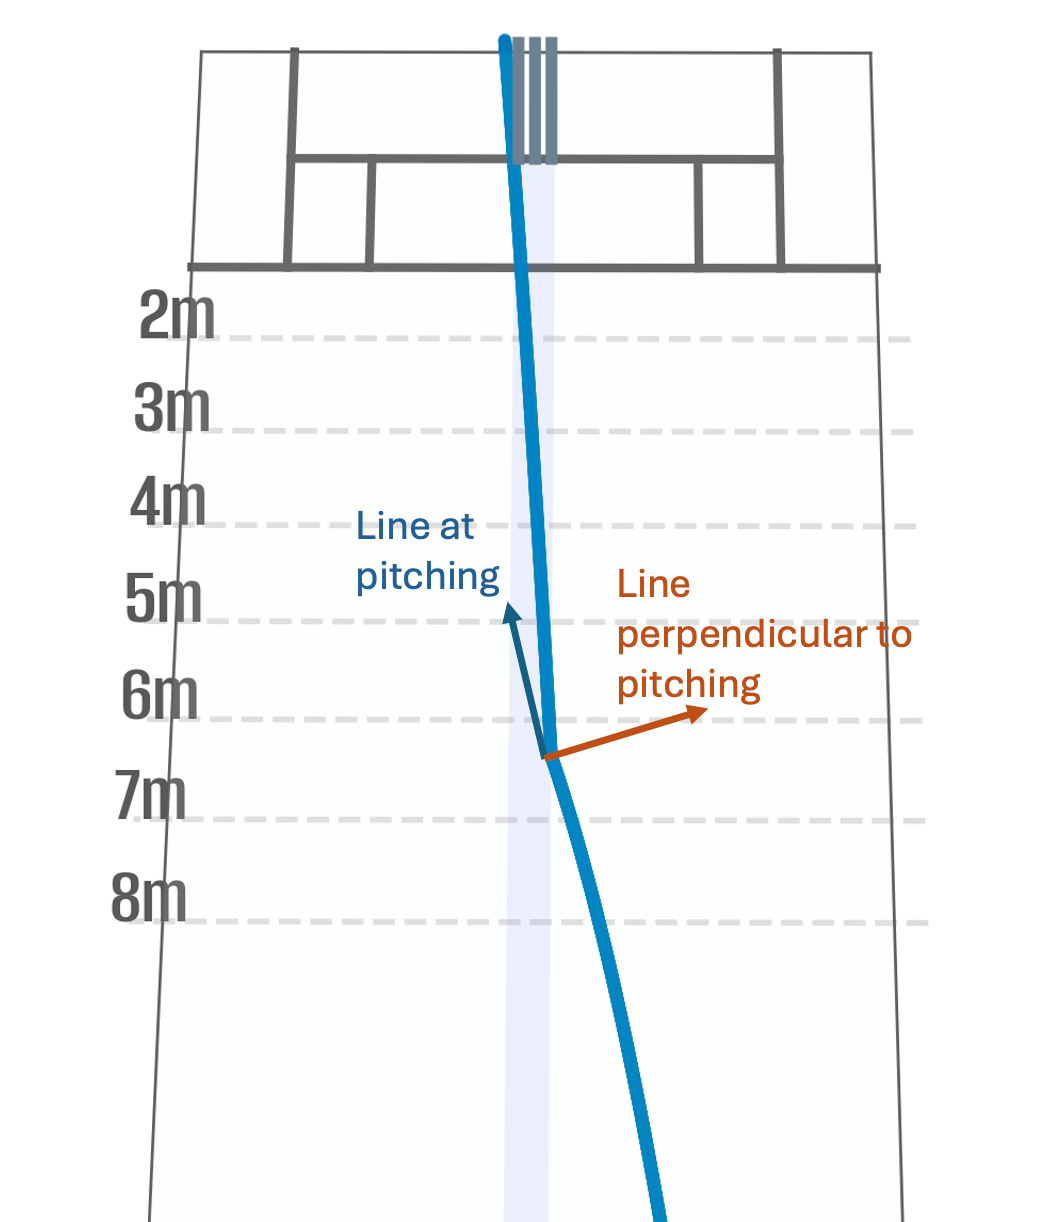
We can write this “impulse” as three components that are calculated by a change in velocity due to pitching, computed along three orthogonal dimensions:
Along the pre-pitching line of the ball (blue arrow): a result of the motion of the ball in the air, and the revs imparted on it (the direction of the seam and how hard the ball is spinning). We call this dv_par or J_par.
Perpendicular to the pre-pitching line (orange arrow): this is entirely due to the revs on the ball, the impulse in the direction normal (at 90 degrees) to the direction in which the ball was travelling before bouncing. We call this dv_perp or J_perp.
In the vertical direction: the change in vertical speed. We call this dv_z or J_z.
Here is how J_par and J_perp are related to turn in degrees:
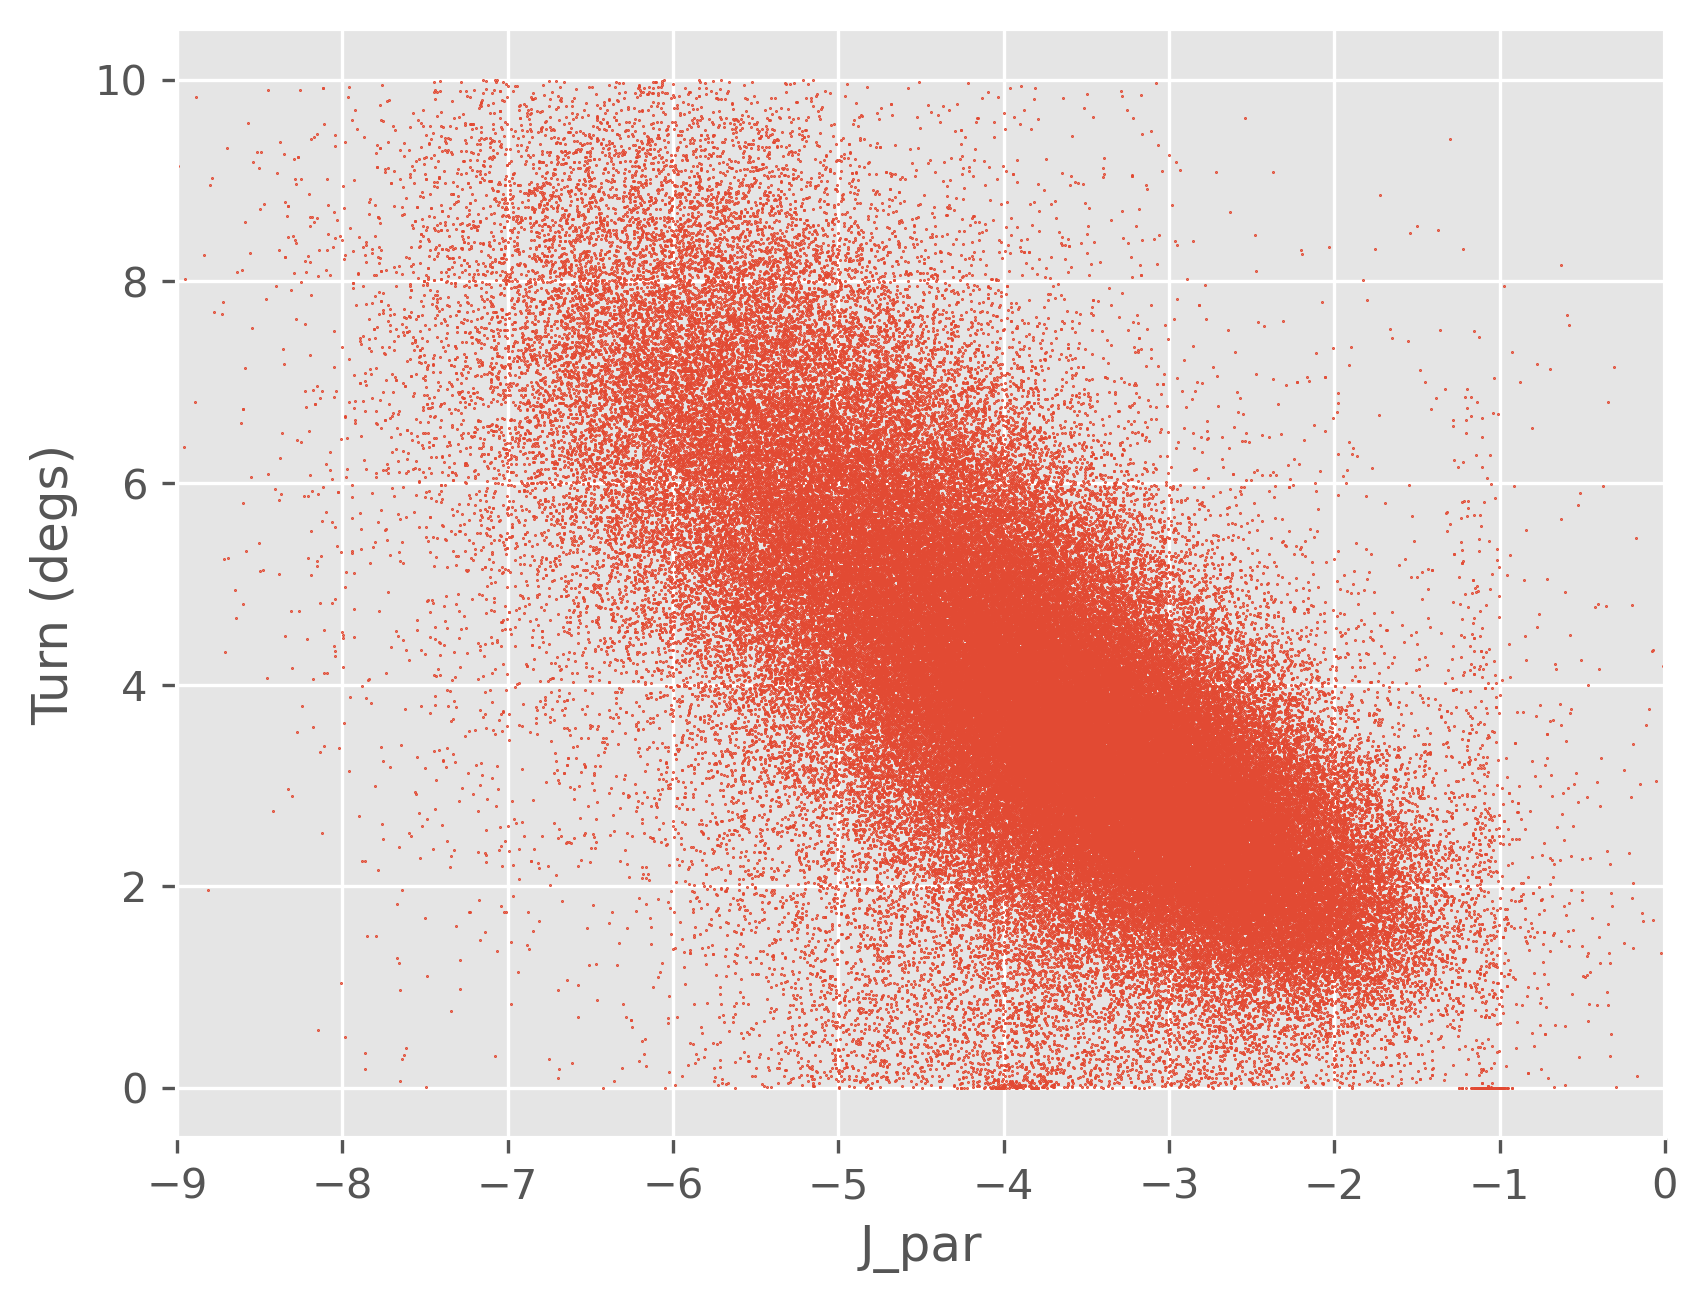
We see here that the change in velocity along the line of pitching is always negative (the ball loses speed), and is correlated with the turn.
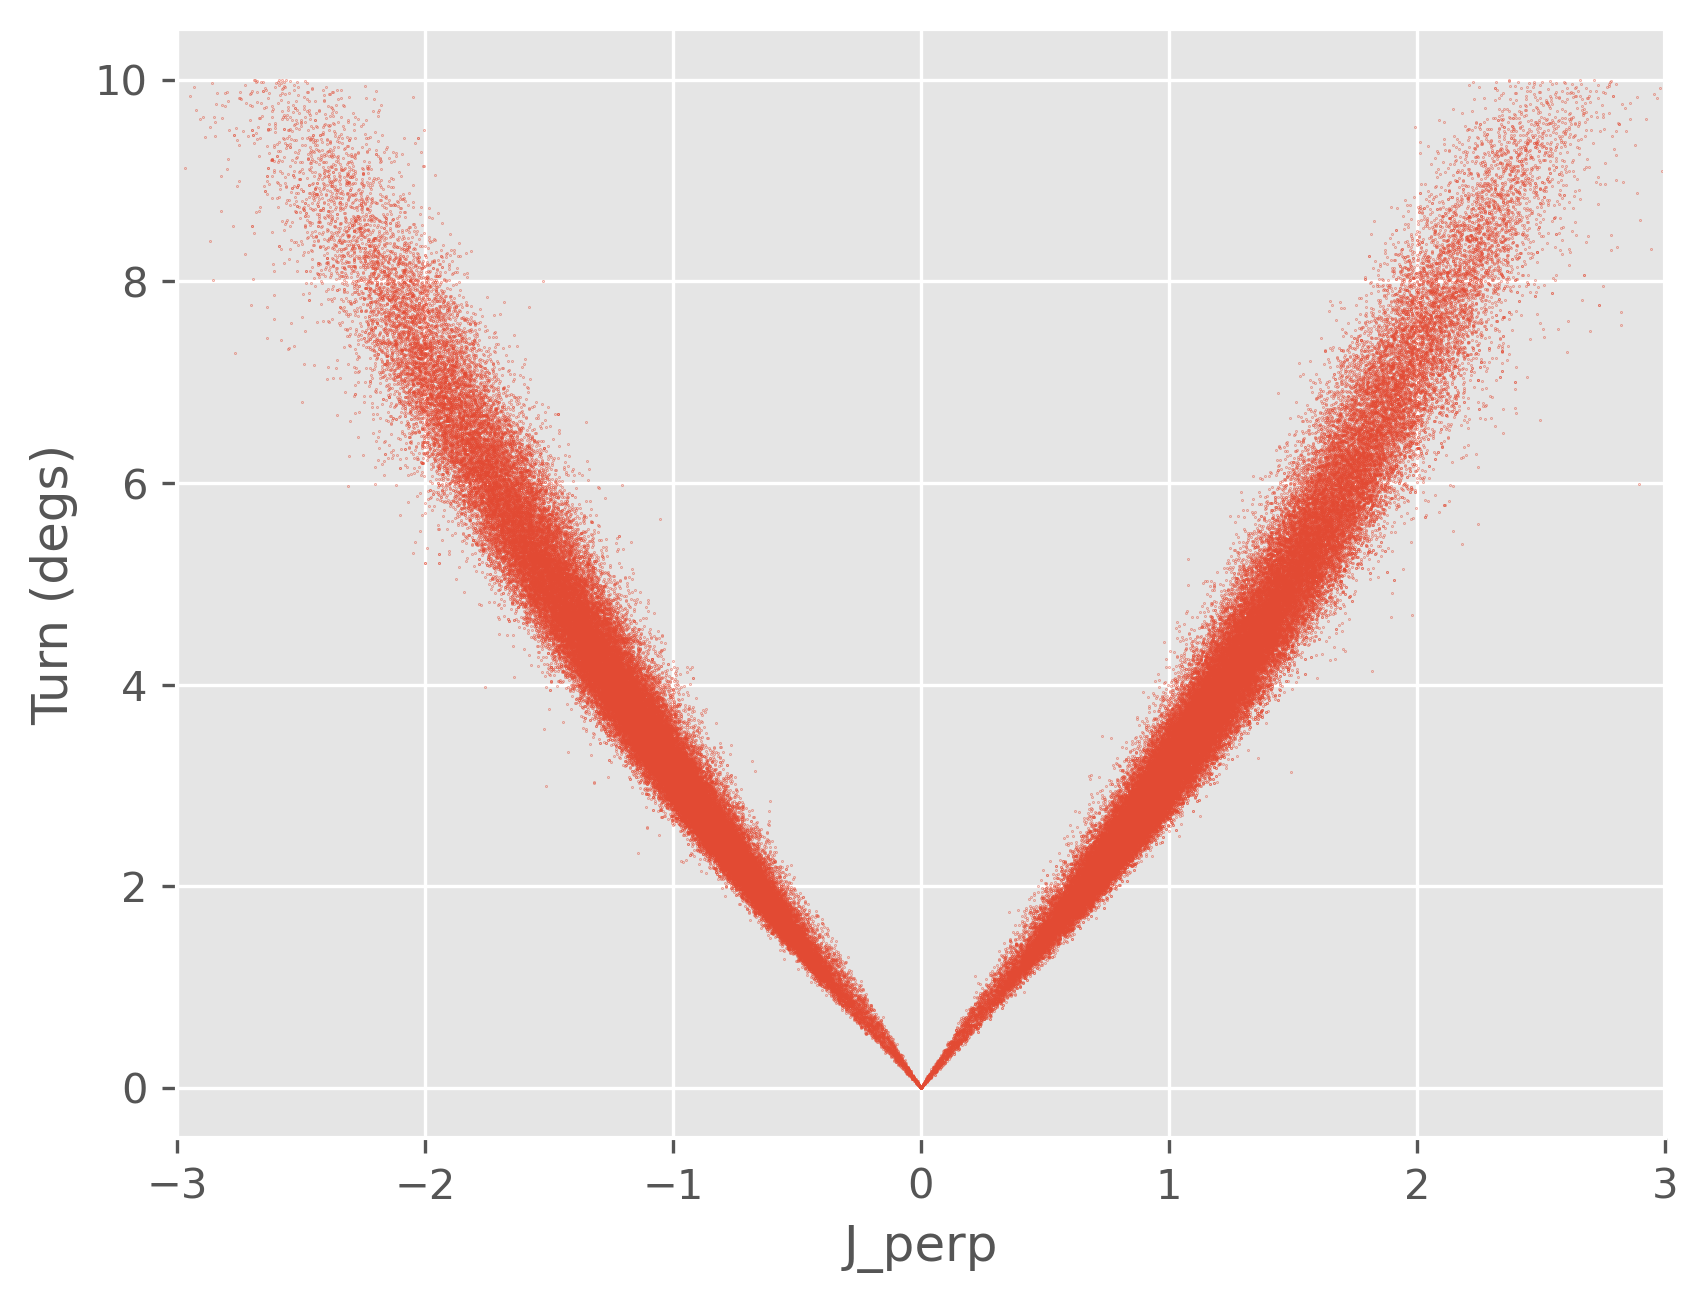
In the second plot, we have J_perp, the change in speed perpendicular to the pitching line, which can go in either direction (two directions of spin). This is very tightly correlated with the turn. Now, if we plot both against J_z, we see that both are proportional to J_z:
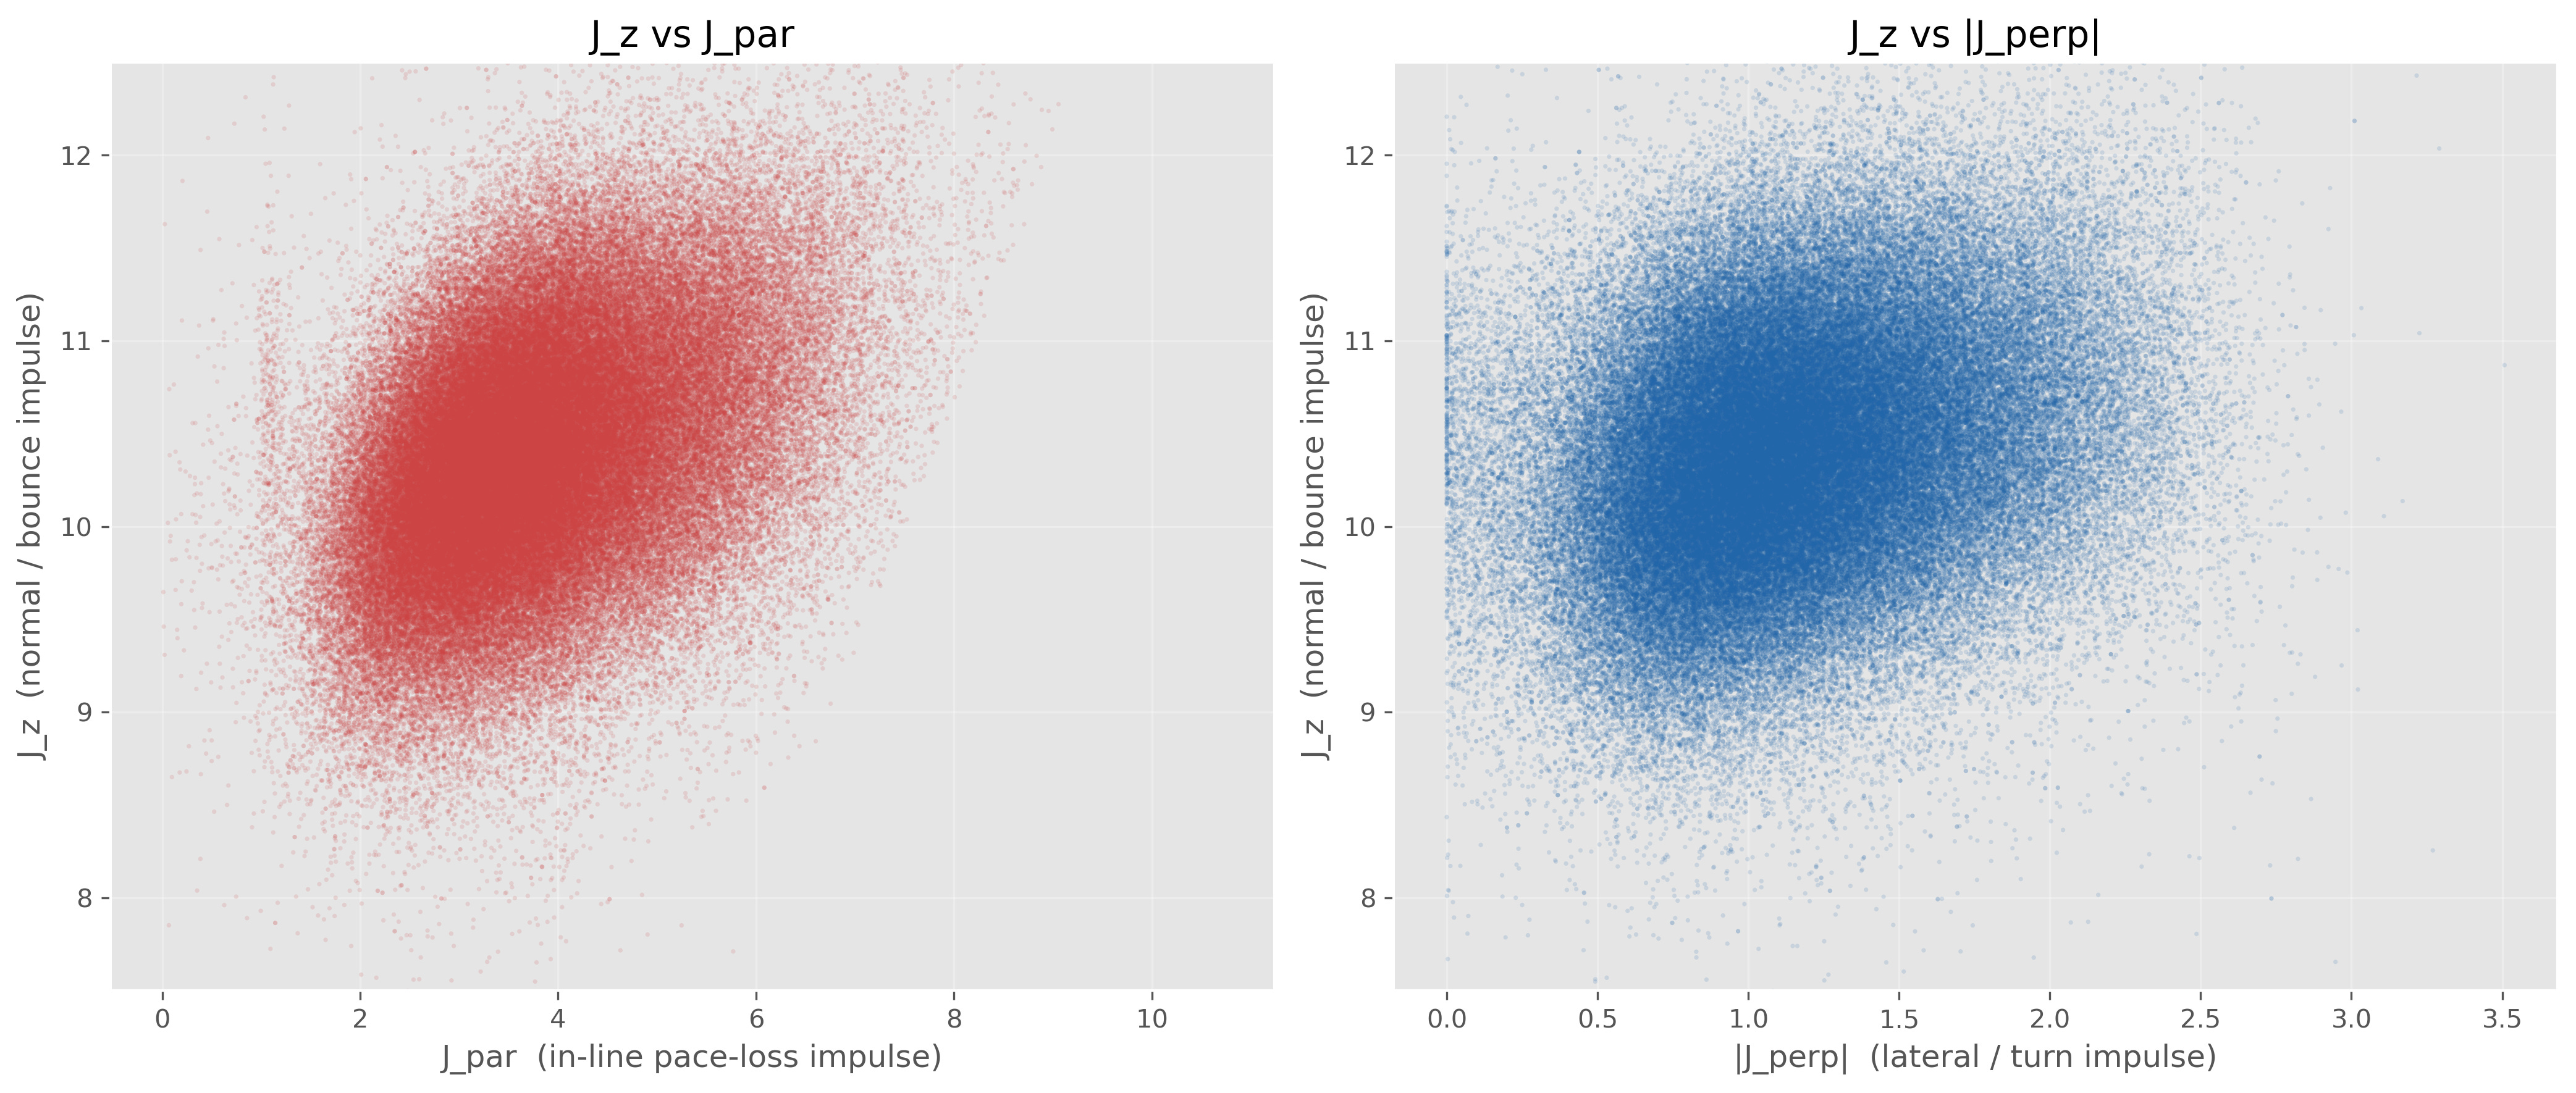
This tells us that the force responsible for “spin” is friction, which is always proportional to the normal force. This normal force is represented by J_z in our setup. The more the change in vertical velocity, the higher the friction in general, giving higher grip off the pitch.
To nullify the effect of J_z on the other Js, we divide J_par and J_perp by J_z to get the “grip”:
line_grip = |J_par| / J_z: grip in the direction of pre-bounce travel of the ball.
turn_grip = |J_perp|/J_z: grip in the direction perpendicular to the travel of the ball.
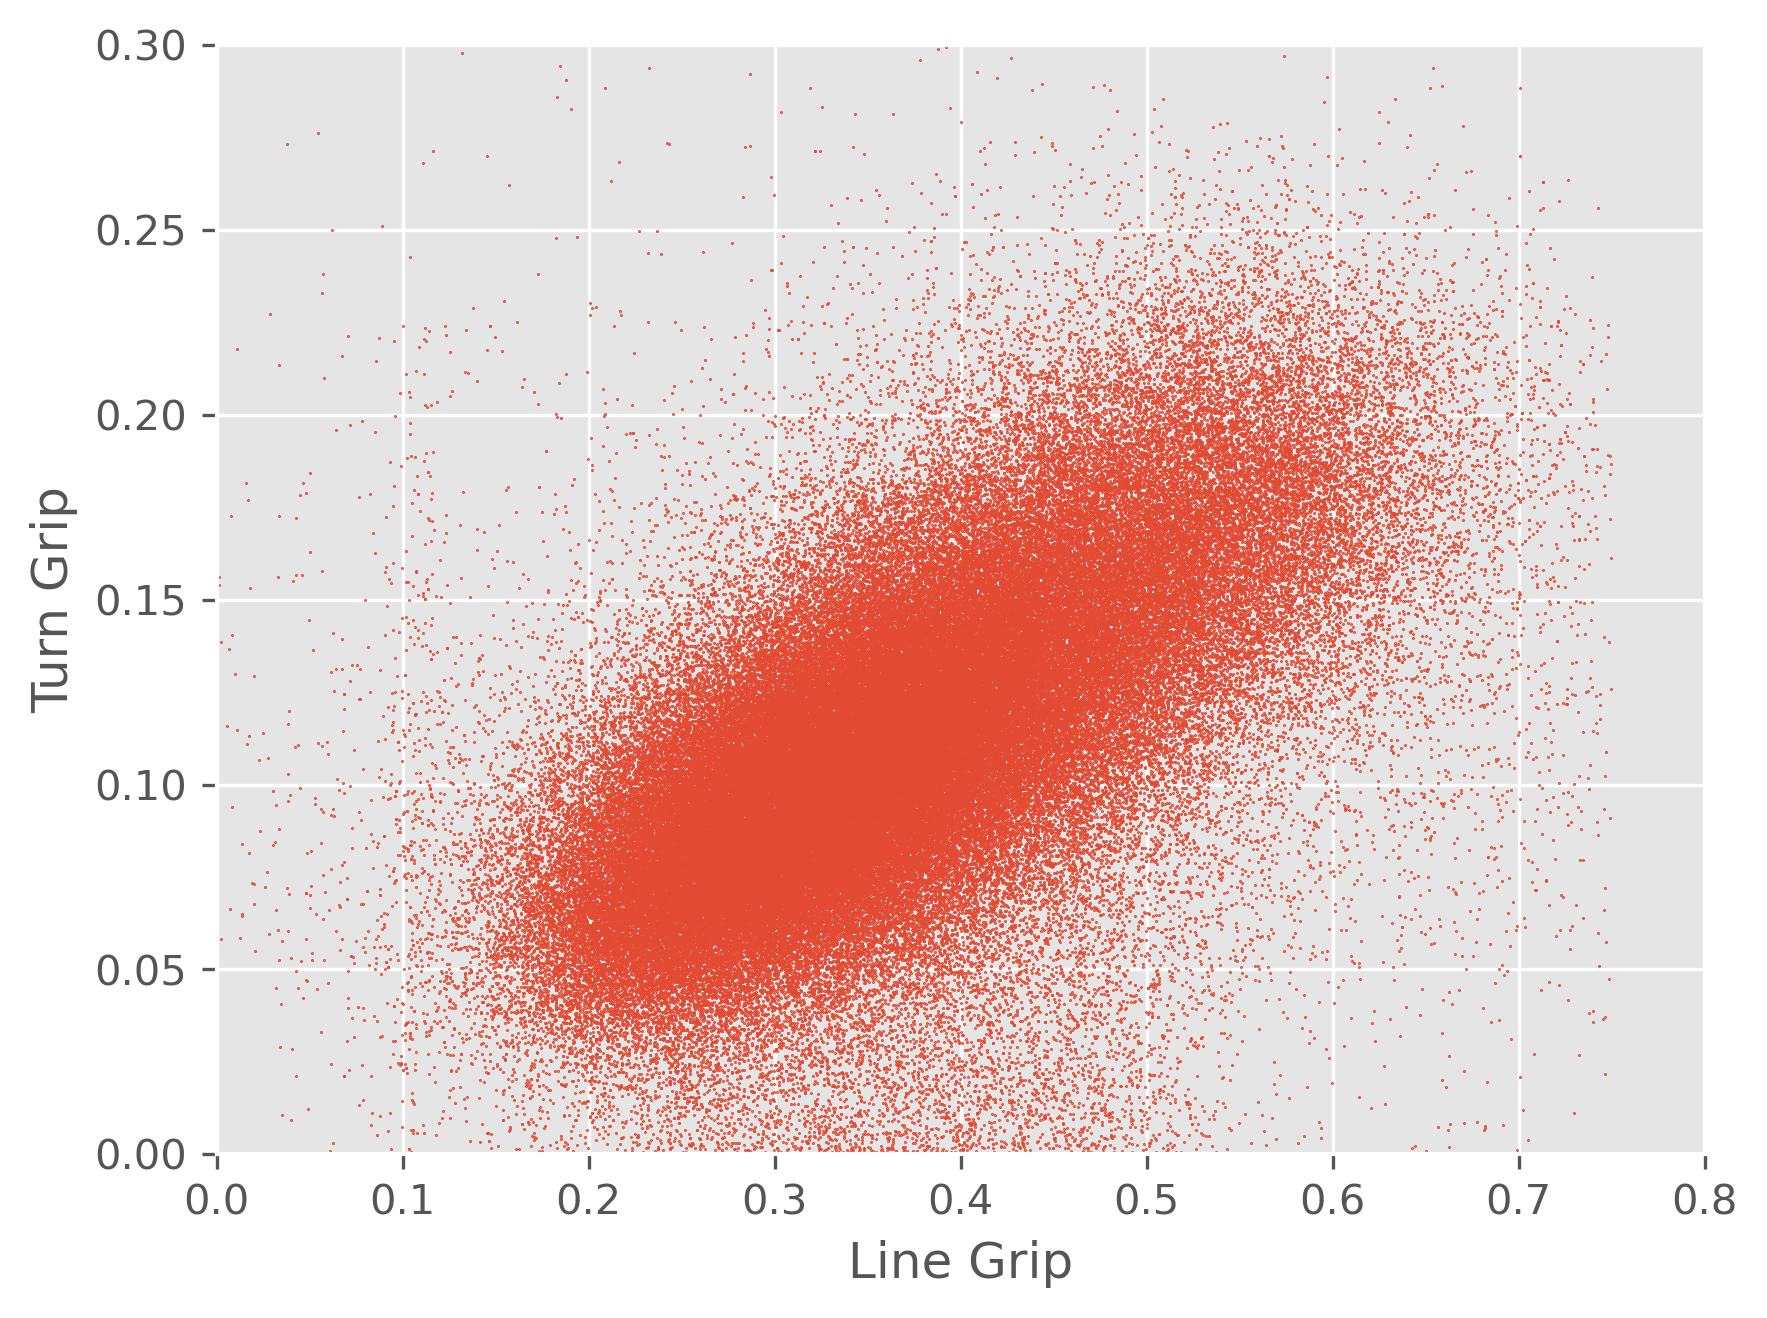
We see that both these are proportional to each other. That makes sense, they are both resulting from the same underlying mechanism, broadly: friction. We also notice that the turn grip is roughly 0.2-0.3x the line grip. Despite this lower magnitude, the turn_grip, or the change in speed perpendicular to the ball’s travel, is mainly responsible for turn.
Turn is the change in the angle of the ball upon pitching. This is influenced by both the parallel change in speed and the perpendicular change, but the former has a much weaker effect. This can be shown by expressing the formula for turn in terms of J_par and J_perp, which finally tells you that the relative sensitivity of turn to J_perp vs J_par is proportional to the turn itself! At 5 degrees of turn, the turn is 11x more sensitive to J_perp than J_par! We shall see this in our results soon!
What Influences Turn?
Here, I will show you four plots, plotting mean turn vs different kinematical quantities of the delivery before bounce. This helps us explore the physical relationships between the trajectory of the ball and the resulting turn.
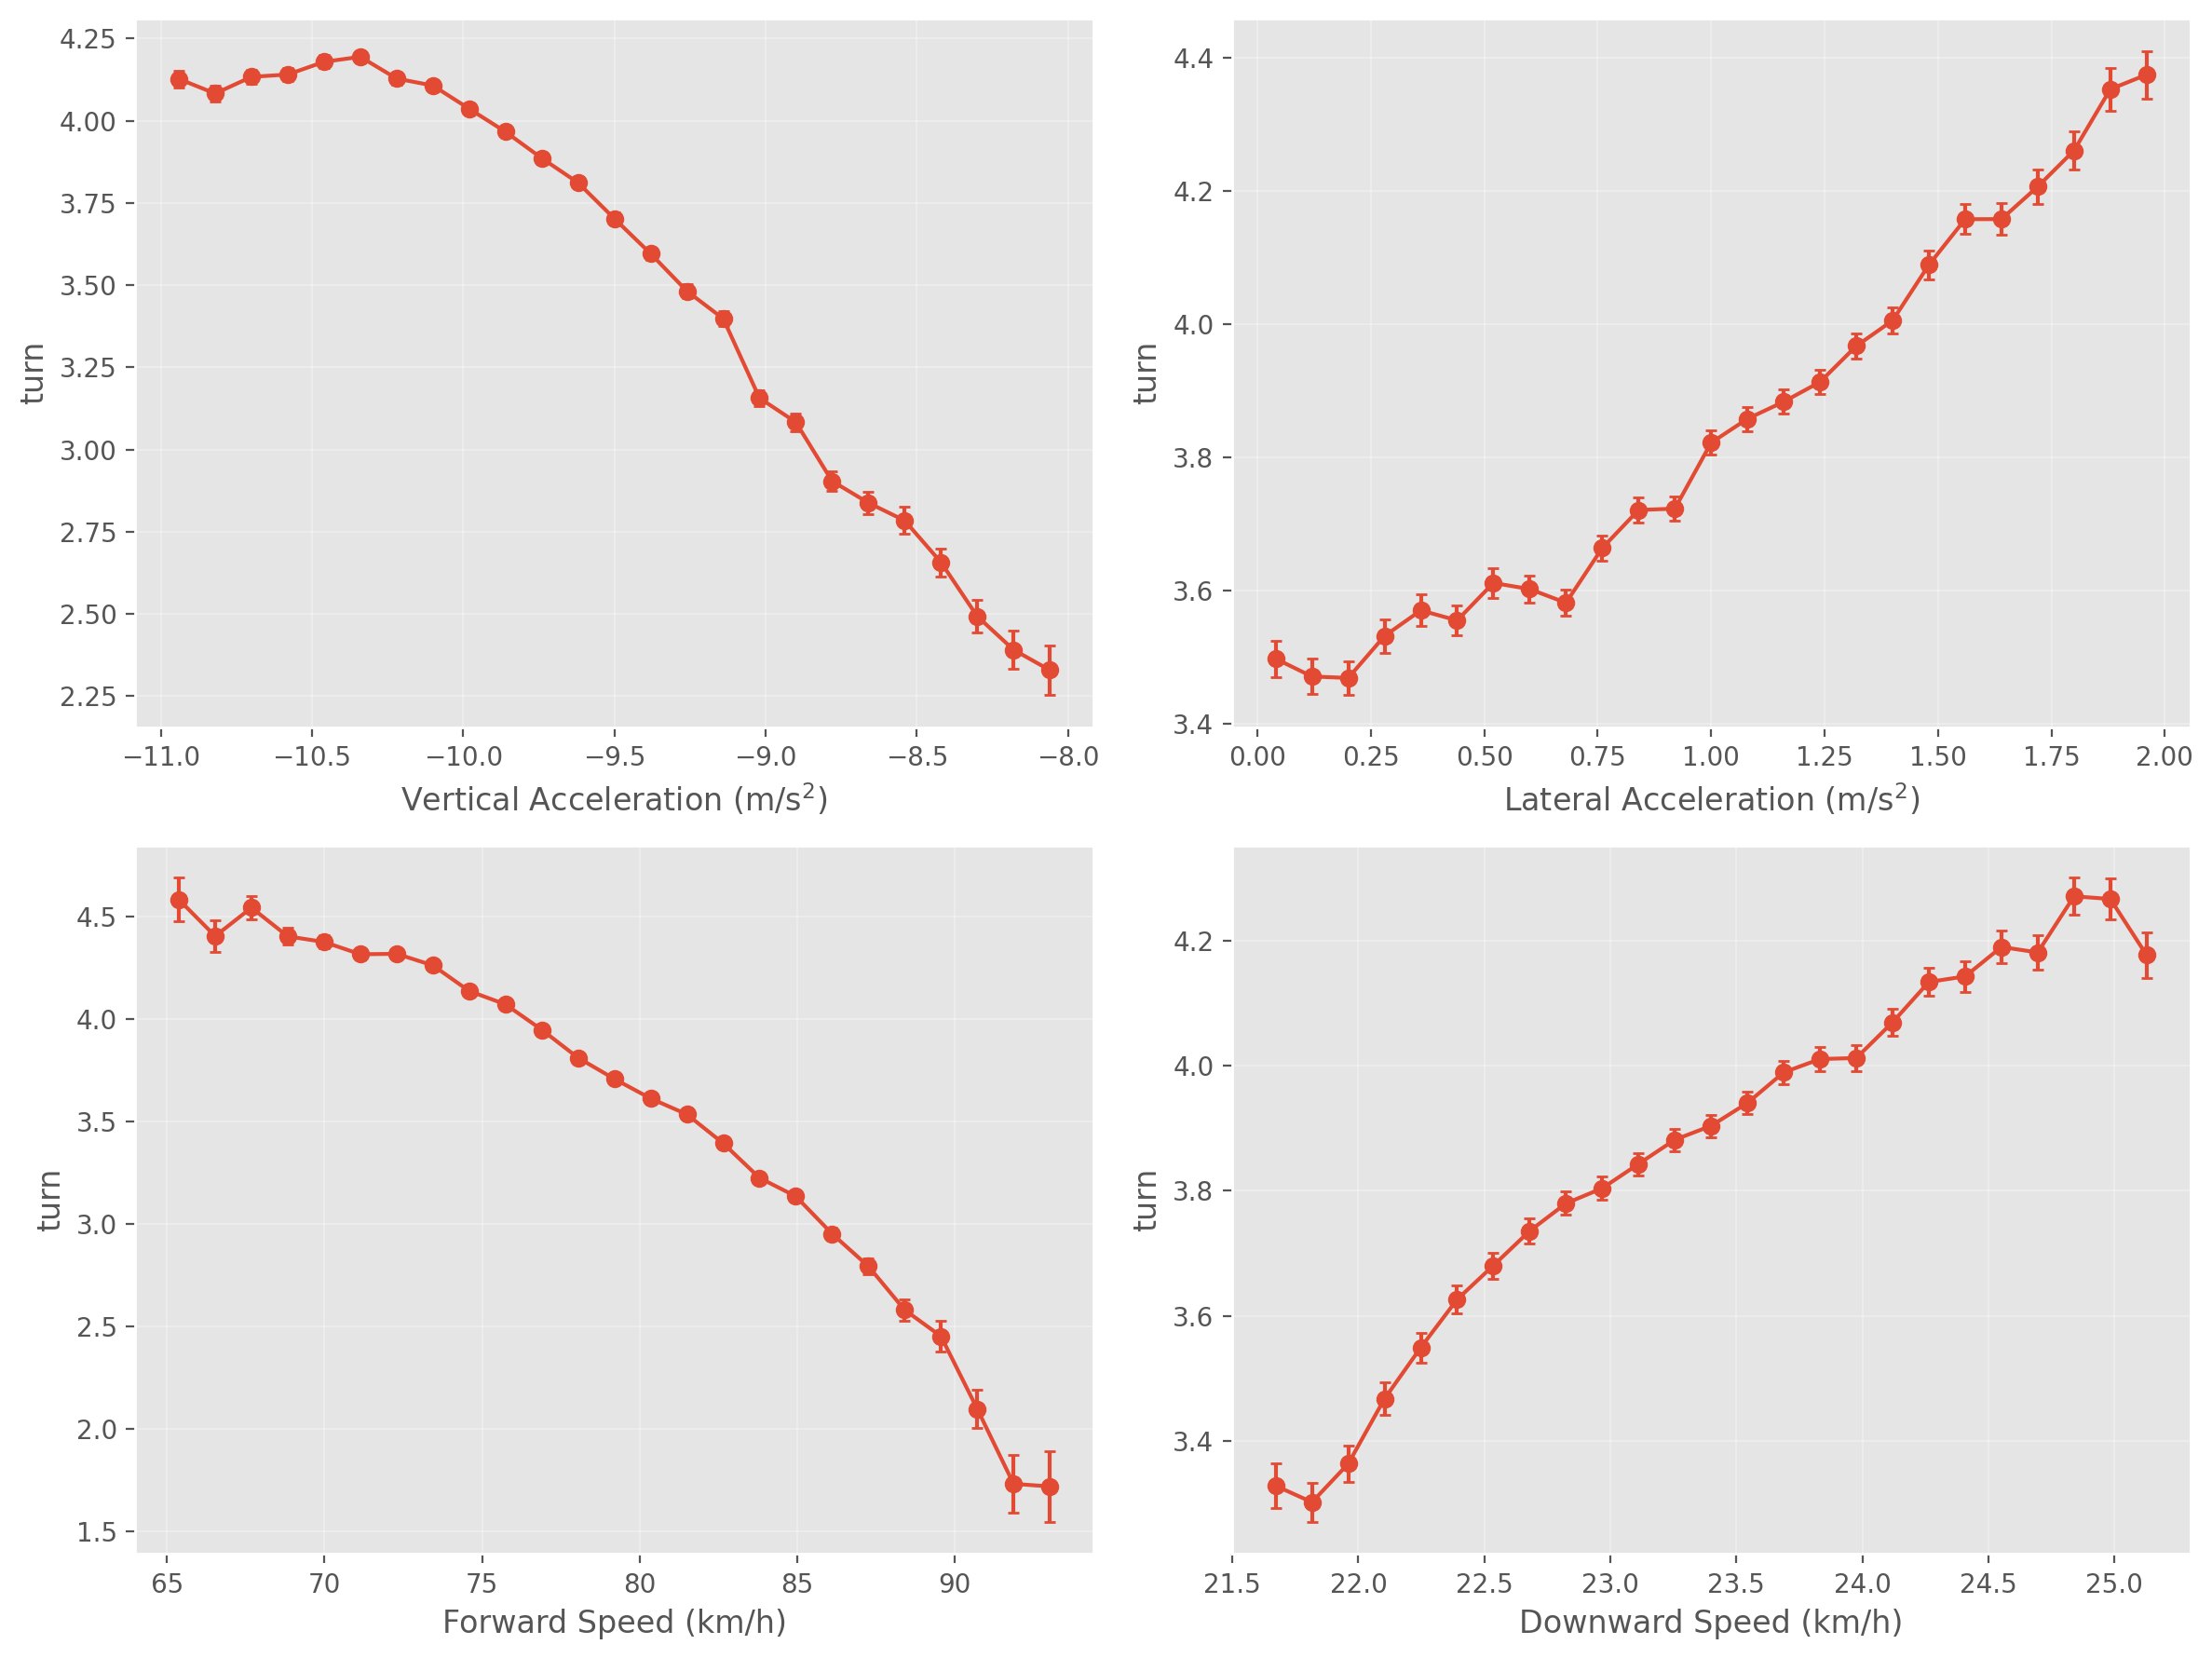
Top Left: Vertical Acceleration
As you go rightward on the x-axis, the vertical acceleration decreases in magnitude. The “dip” due to the overspin and the Magnus Force decreases, the ball falls “flatter” into the pitch. We see that in general, less dip = less turn. We have to be careful here: there is a confounding variable. Bowlers usually slow it down when they bowl with more dip, so this high turn and high dip is a result of both high dip and lower speeds on average.
Top Right: Sideways Acceleration
The sideways acceleration measures the force on the ball that causes drift in the air. My initial thought was that drift should be proportional to turn, which is what comes out of this “averaged” plot. My friend Aaron Briggs, cricket ball dynamicist and ECB analyst, maintains that the “drift” we see on spinning balls is mostly due to swing and not the Magnus effect. When you check the dependence of this lateral acceleration on the forward release speed, a neat proportionality emerges, lending credence to his idea. Nevertheless, we see here that the turn holds a nice linear relationship with the drift, indicating that the sidespin revs that (possibly) cause drift also have a role to play in turn.
Bottom Left: Forward Speed
This one is pretty obvious: the turn decreases as the ball speed in the forward direction increases. Turn is, after all, a change in direction of the ball. The direction is the ratio of the forward to sideways speed. A higher forward speed means you need a higher sdieways speed change to change the angle upon pitching. This leads to lower turn.
Bottom Right: Downward Speed
This one is cognate with the top-left: a higher downward speed before bouncing leads to more turn as the ball bounces into the pitch at a steeper angle, hitting it harder. This makes for a higher J_z (normal force) and higher grip.
Three Other Factors
The above four plots show the effect of the primary properties of the pre-bounce trajectory on turn. In addition to these, we have three other factors:
Bowler identity: this captures the skill of an individual bowler that is not captured in the pre-bounce drift / speed numbers in a simple manner.
Innings: the condition of the pitch changes across the Test match, with the turn increasing monotonically in most countries as the match progresses.
Ball condition: the state of the ball (new or old). We do not have any data for this.
Ground identity: the most important, the contribution of the specific ground.
The Turn Model
Model
Our primary objective in this work is to establish a method to rank individual grounds on the basis of the “turn” they offer. The naivest approach to this would be calculating the average turn on a ground, but this leads to spurious results. Grounds in SENA nations where a few, very competent spinners have bowled only on days 4 and 5 get a very high ranking by this method. For instance, this method tells you that Australian pitches have the most turn, which clearly goes against cricket logic.
A smarter way to do this pitch rating is to take “known turners”, spinners who have bowled a lot on different grounds. By comparing a spinner’s baseline turn vs the turn at a given ground and systematically summing these ratios up, we can arrive at a +/- turn rating for every ground.
A more systematic way of doing this while also accounting for the effects of the pre-bounce trajectory and the bowler is using a mixed effects linear model to predict the turn. In our model, we have four continuous trajectory variables and one categorical variable, which make up the fixed effects:
magnus_z: pre-bounce vertical acceleration with gravity subtracted, in m/s^2. +ve is dip.
vz0: magnitude of pre-bounce vertical velocity in m/s
vx0: magnitude of pre-bounce forward velocity (along the pitch towards the batter) in m/s
abs_ay0: magnitude of pre-bounce sideways acceleration in m/s^2.
Inns: 1,2,3,4
In addition, we have two categorical variables encoding random effects:
Bowler
Ground
The former 5 variables give us one number for each variable: a global, average effect encoding the relations between the variables and turn. The latter two variables give us one number for each bowler and ground, treating both as random variables.
Result Summary
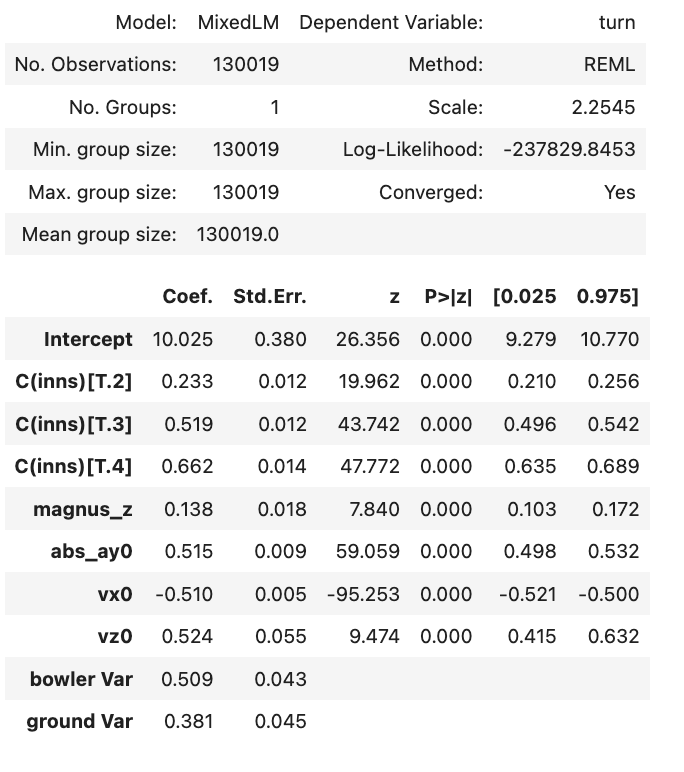
A few points from this fitting summary table:
The innings effect: The inns coefs show how much turn changes by the inns, with inns=1 being the baseline. The turn systematically increases as the match goes deeper. The second inns shows 0.23 degrees more turn than the 1st. The 3rd shows 0.28 degrees more than the second, and so on.
Magnus_z: a small positive coef, which matches our earlier visual inpection: more dip = more turn. Keep in mind that this model already subtracts the effects of slower speeds and higher vz0 at the linear level, so this coef encodes a relatively uncontaminated effect of dip on turn.
abs_ay0: This too confirms our visual inspection. The turn degrees change by 0.515 per unit of sideways acceleration. A deeper debate with Aaron pending, we shall for now take this as the effect of sidespin on turn.
vx0: a negative coef, implying that a higher forward speed leads to lower turn, as we saw earlier.
vz0: positive coef, showing that a ball banging harder into the pitch gets more turn. This coef mostly absorbs the effect of magnus_z, because the vz0 is the downward speed of the ball right before bouncing, which is influenced by vertical acceleration.
Bowler variation: the spread (variance) of the turn^2 resulting from the variability in individual bowlers.
Ground variation: the same as above for individual grounds.
Share of varation: The ‘scale’ = 2.2545 is the variation in turn outside of the variation caused by the bowler and the ground. The total ball-by-ball variance in turn is 2.25 + 0.51 + 0.38 = 3.14.
Bowlers explain 0.51 / 3.14 = 16.2% of the variance.
Grounds explain 0.38 / 3.14 = 12.1% of the variance.
Test
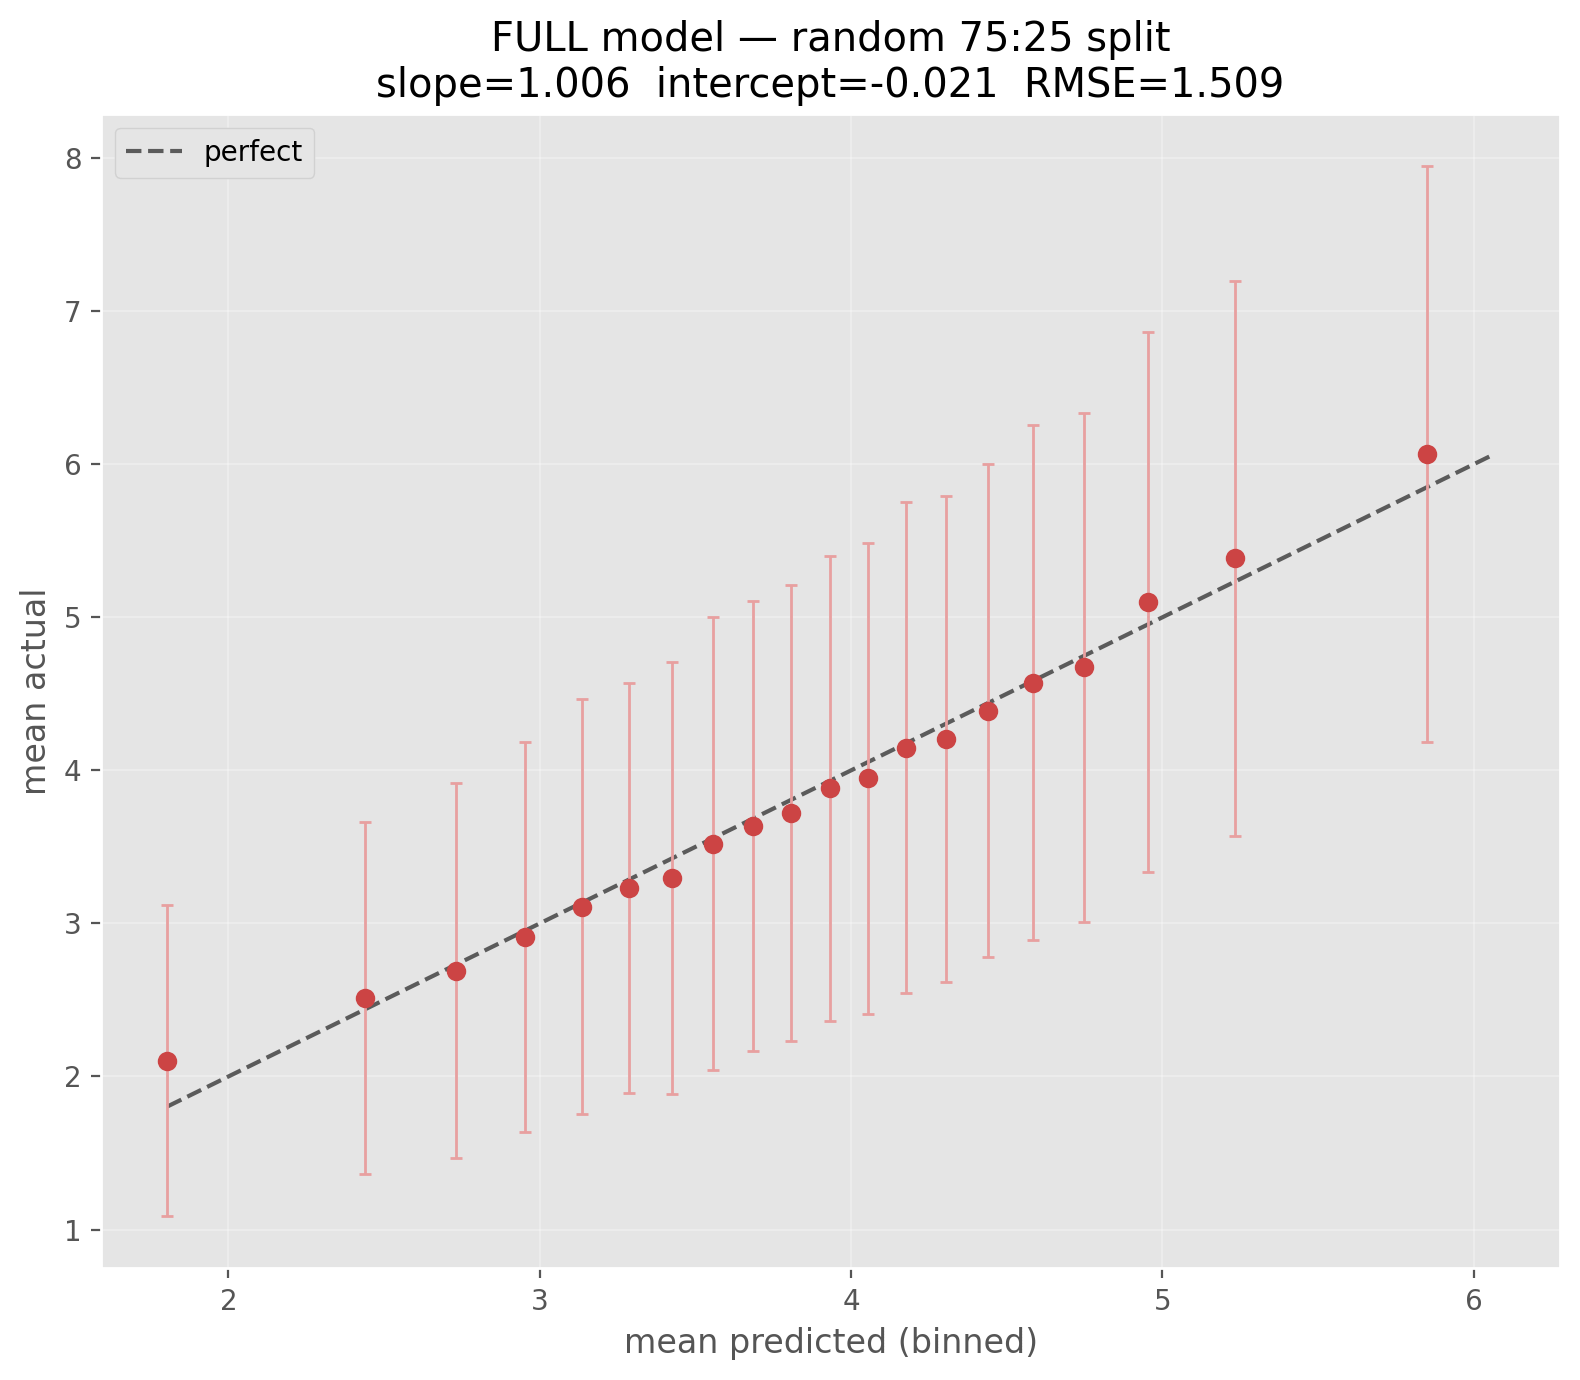
The above results were from the model fit on the training set based on a 75:25 train-test split. Here is a calibration plot on the test set. We see the prediction works well on average, with a slope close to 1 and intercept close to 0.
Ranking Grounds
With this. we can now extract the coeffs for each ground, having accounted for the pre-bounce trajectory and the bowler’s individual characteristics. With the coeffs, we can compute the “average” turn on a “typical” ball on each ground. We take the means of the 4 trajectory variables and take a weighted mean of the inns coeffs from our model to predict the turn (setting bowler effects to zero). The following plot results. It shows the average expected turn by ground:
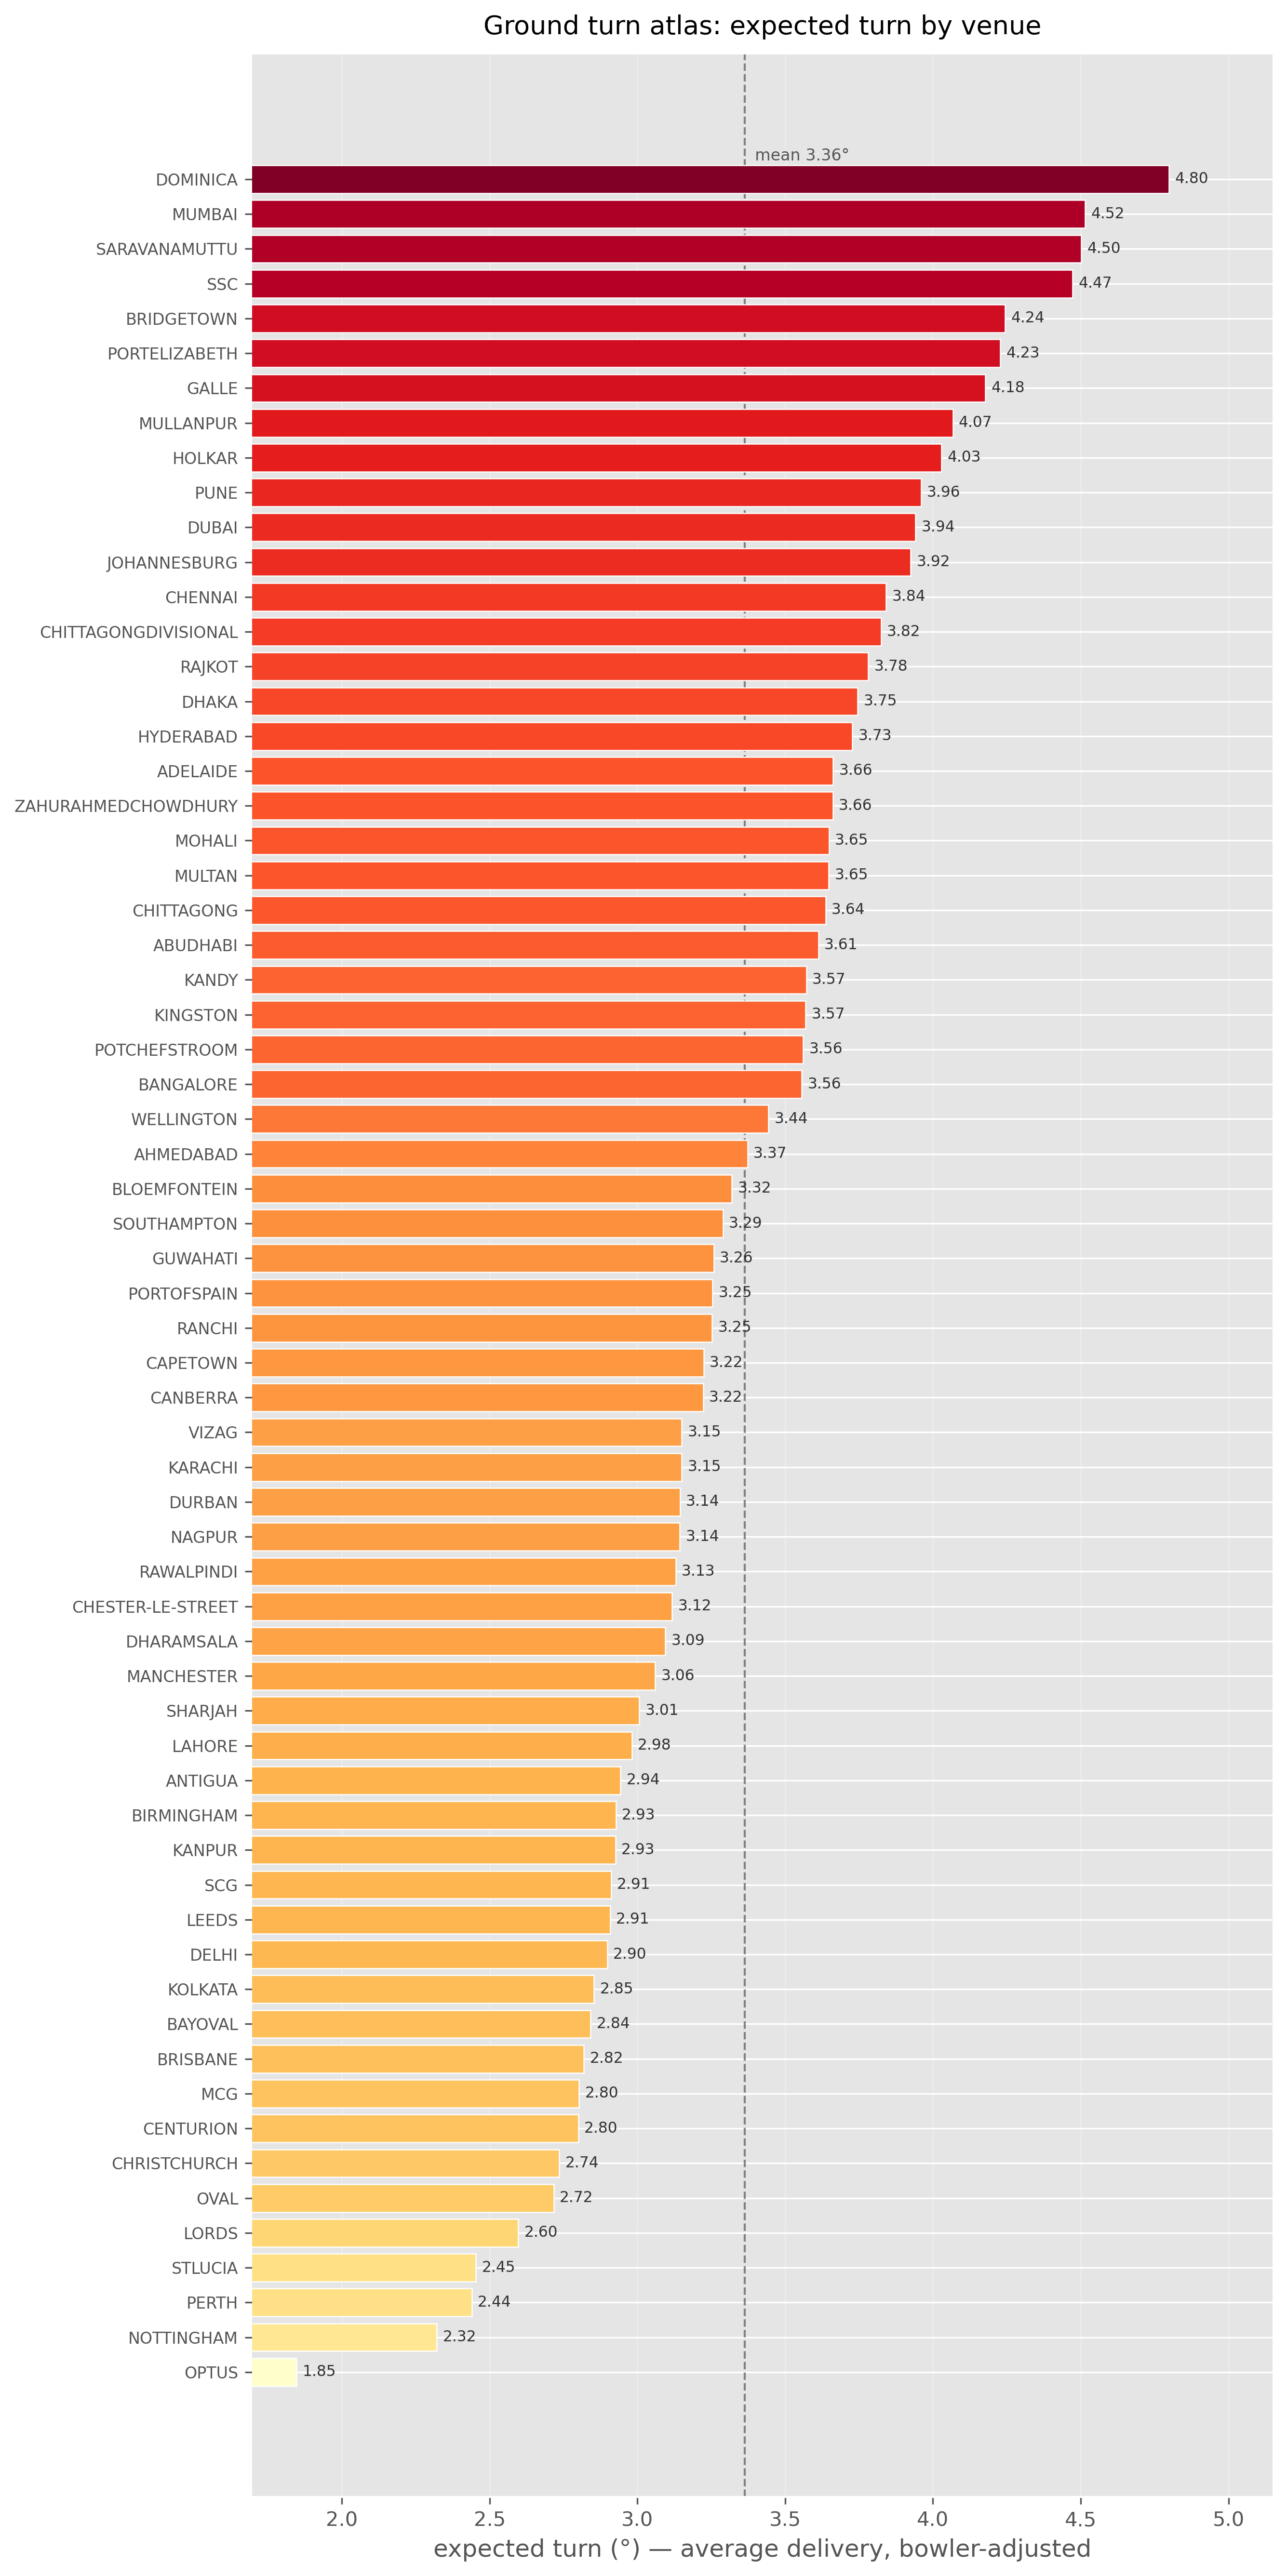
The placement of most grounds on this ranked list makes sense. Optus, Nottingham, Perth are the lowest ranked. Aus and NZ grounds populate the lower half. “Flat” or “slow turn” pitches in Asia are also seen in the lower half of the table. At the top, you have Dominica, Wankhede, PSC, SSC, Galle, Dubai, Chennai, Chittagong, Rajkot, Dhaka etc. The ordering is far from a perfect match with our colloquial, anecdote-based rankings, but it broadly does match up. There are a few SA grounds in the top half, which I can only put down to selection effects. Delhi (Kotla) is the other disquieting entry, placed firmly in the lower half. These rankings are correlated with the bare rankings based on average turn (Delhi sits in the bottom 20 there too), but nevertheless come from a more rigorous method that attempts to account for bowler identity and ball trajectory.
Extending the Model
Next, let’s fit a similar model to predict both line_grip and turn_grip. We will extricate the ground coeffs from both the line_grip and the turn_grip fitting and rank the grounds based on these, along with ranking them on the average turn.
The plot below shows the correlations of the line_grip and turn_grip ranks with the turn ranks:
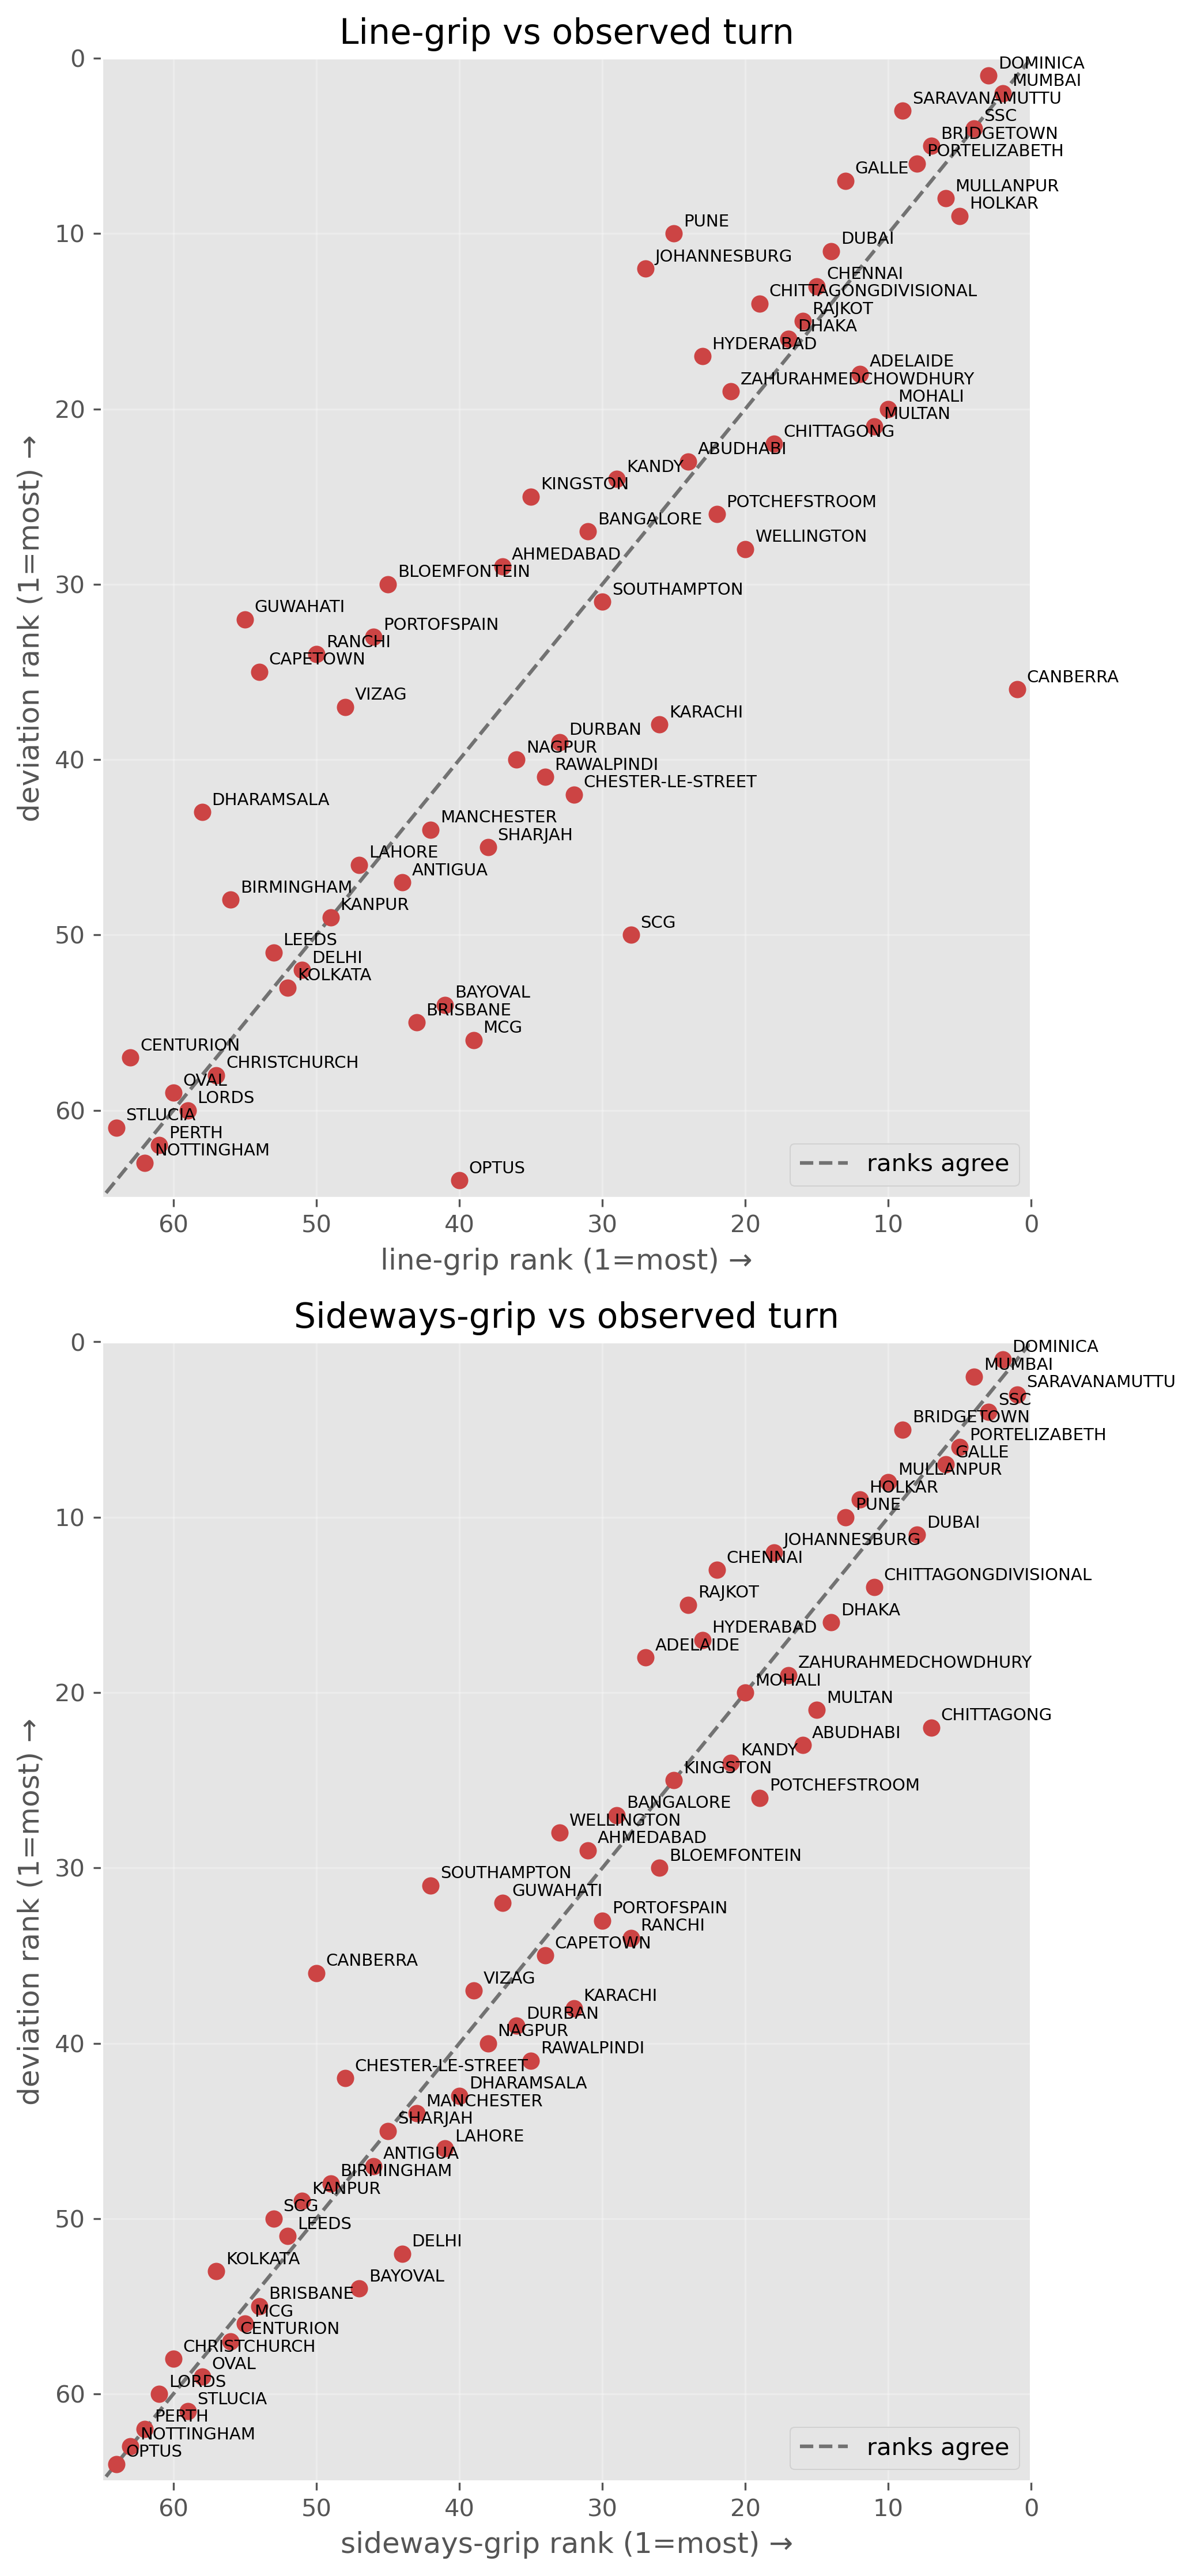
We first see that both the ranks are well-correlated with the turn (deviation) rank, but the sideways grip rank has a much tighter relation with turn rank. This goes back to our point that sideways impulse impacts turn a lot more than line impulse. The correlations of the ranks are:
line-grip vs deviation    : 0.867
sideways-grip vs deviation: 0.967
We can take the line_grip and turn_grip coefficients from these latest fits and plot them on a plane for each ground:
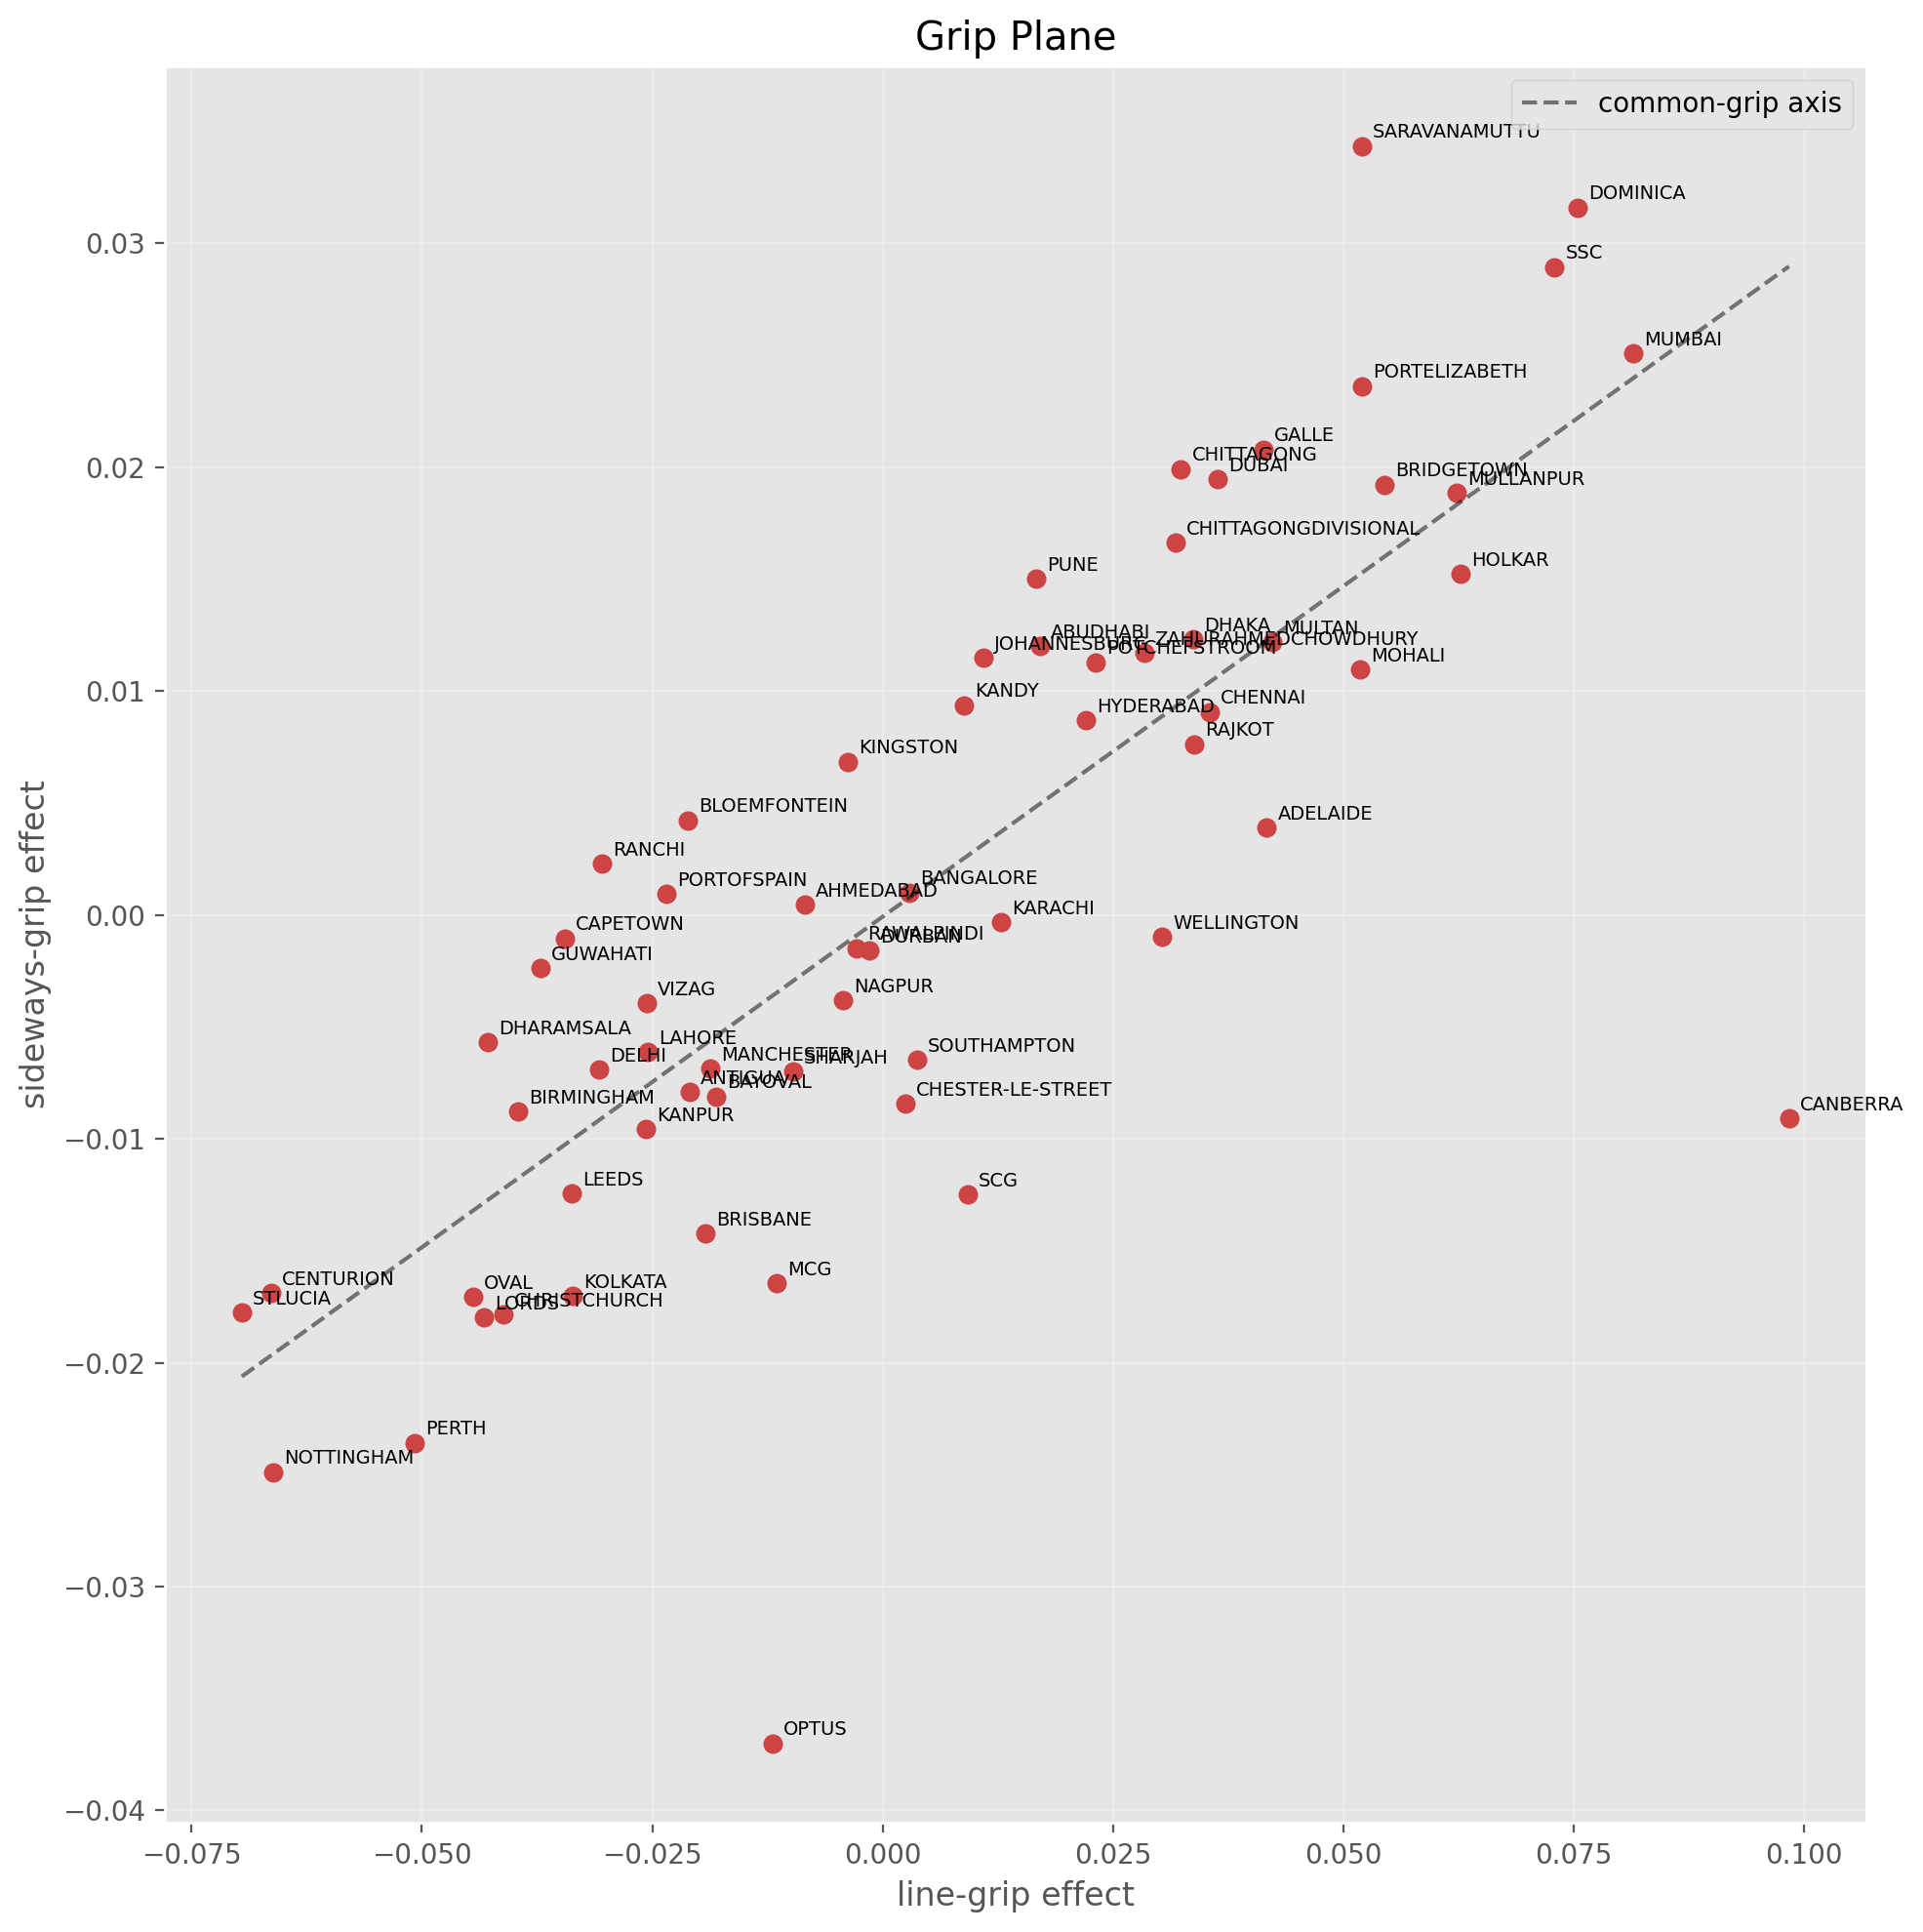
As is apparent, these two coeffs are correlated (correlation coeff of 0.78), which points us to our very first plots showing the high correlation between sideways and line grip. What we need to do is rotate these points to get a new scatter plot. This rotated scatter plot will show us two numbers: one along the common, shared, trendline (dashed line), and one along the direction perpendicular to it. Thus, a rotation will “decorrelate” the two dimensions. Here is the rotated plot:
The x-axis shows you the total grip: the distance of the point along the dashed line in the first plot. The higher this number is, the more “grippy” a surface is for spin. The y-axis shows you something uncorrelated with this total grip: it shows you the propensity for sideways impulse off the pitch. In terms of the first plot, it shows you how far away the point is from the dashed line. The colour shows you the “turn effect” on the ground: how much the ball turns compared to the average ground in the dataset.
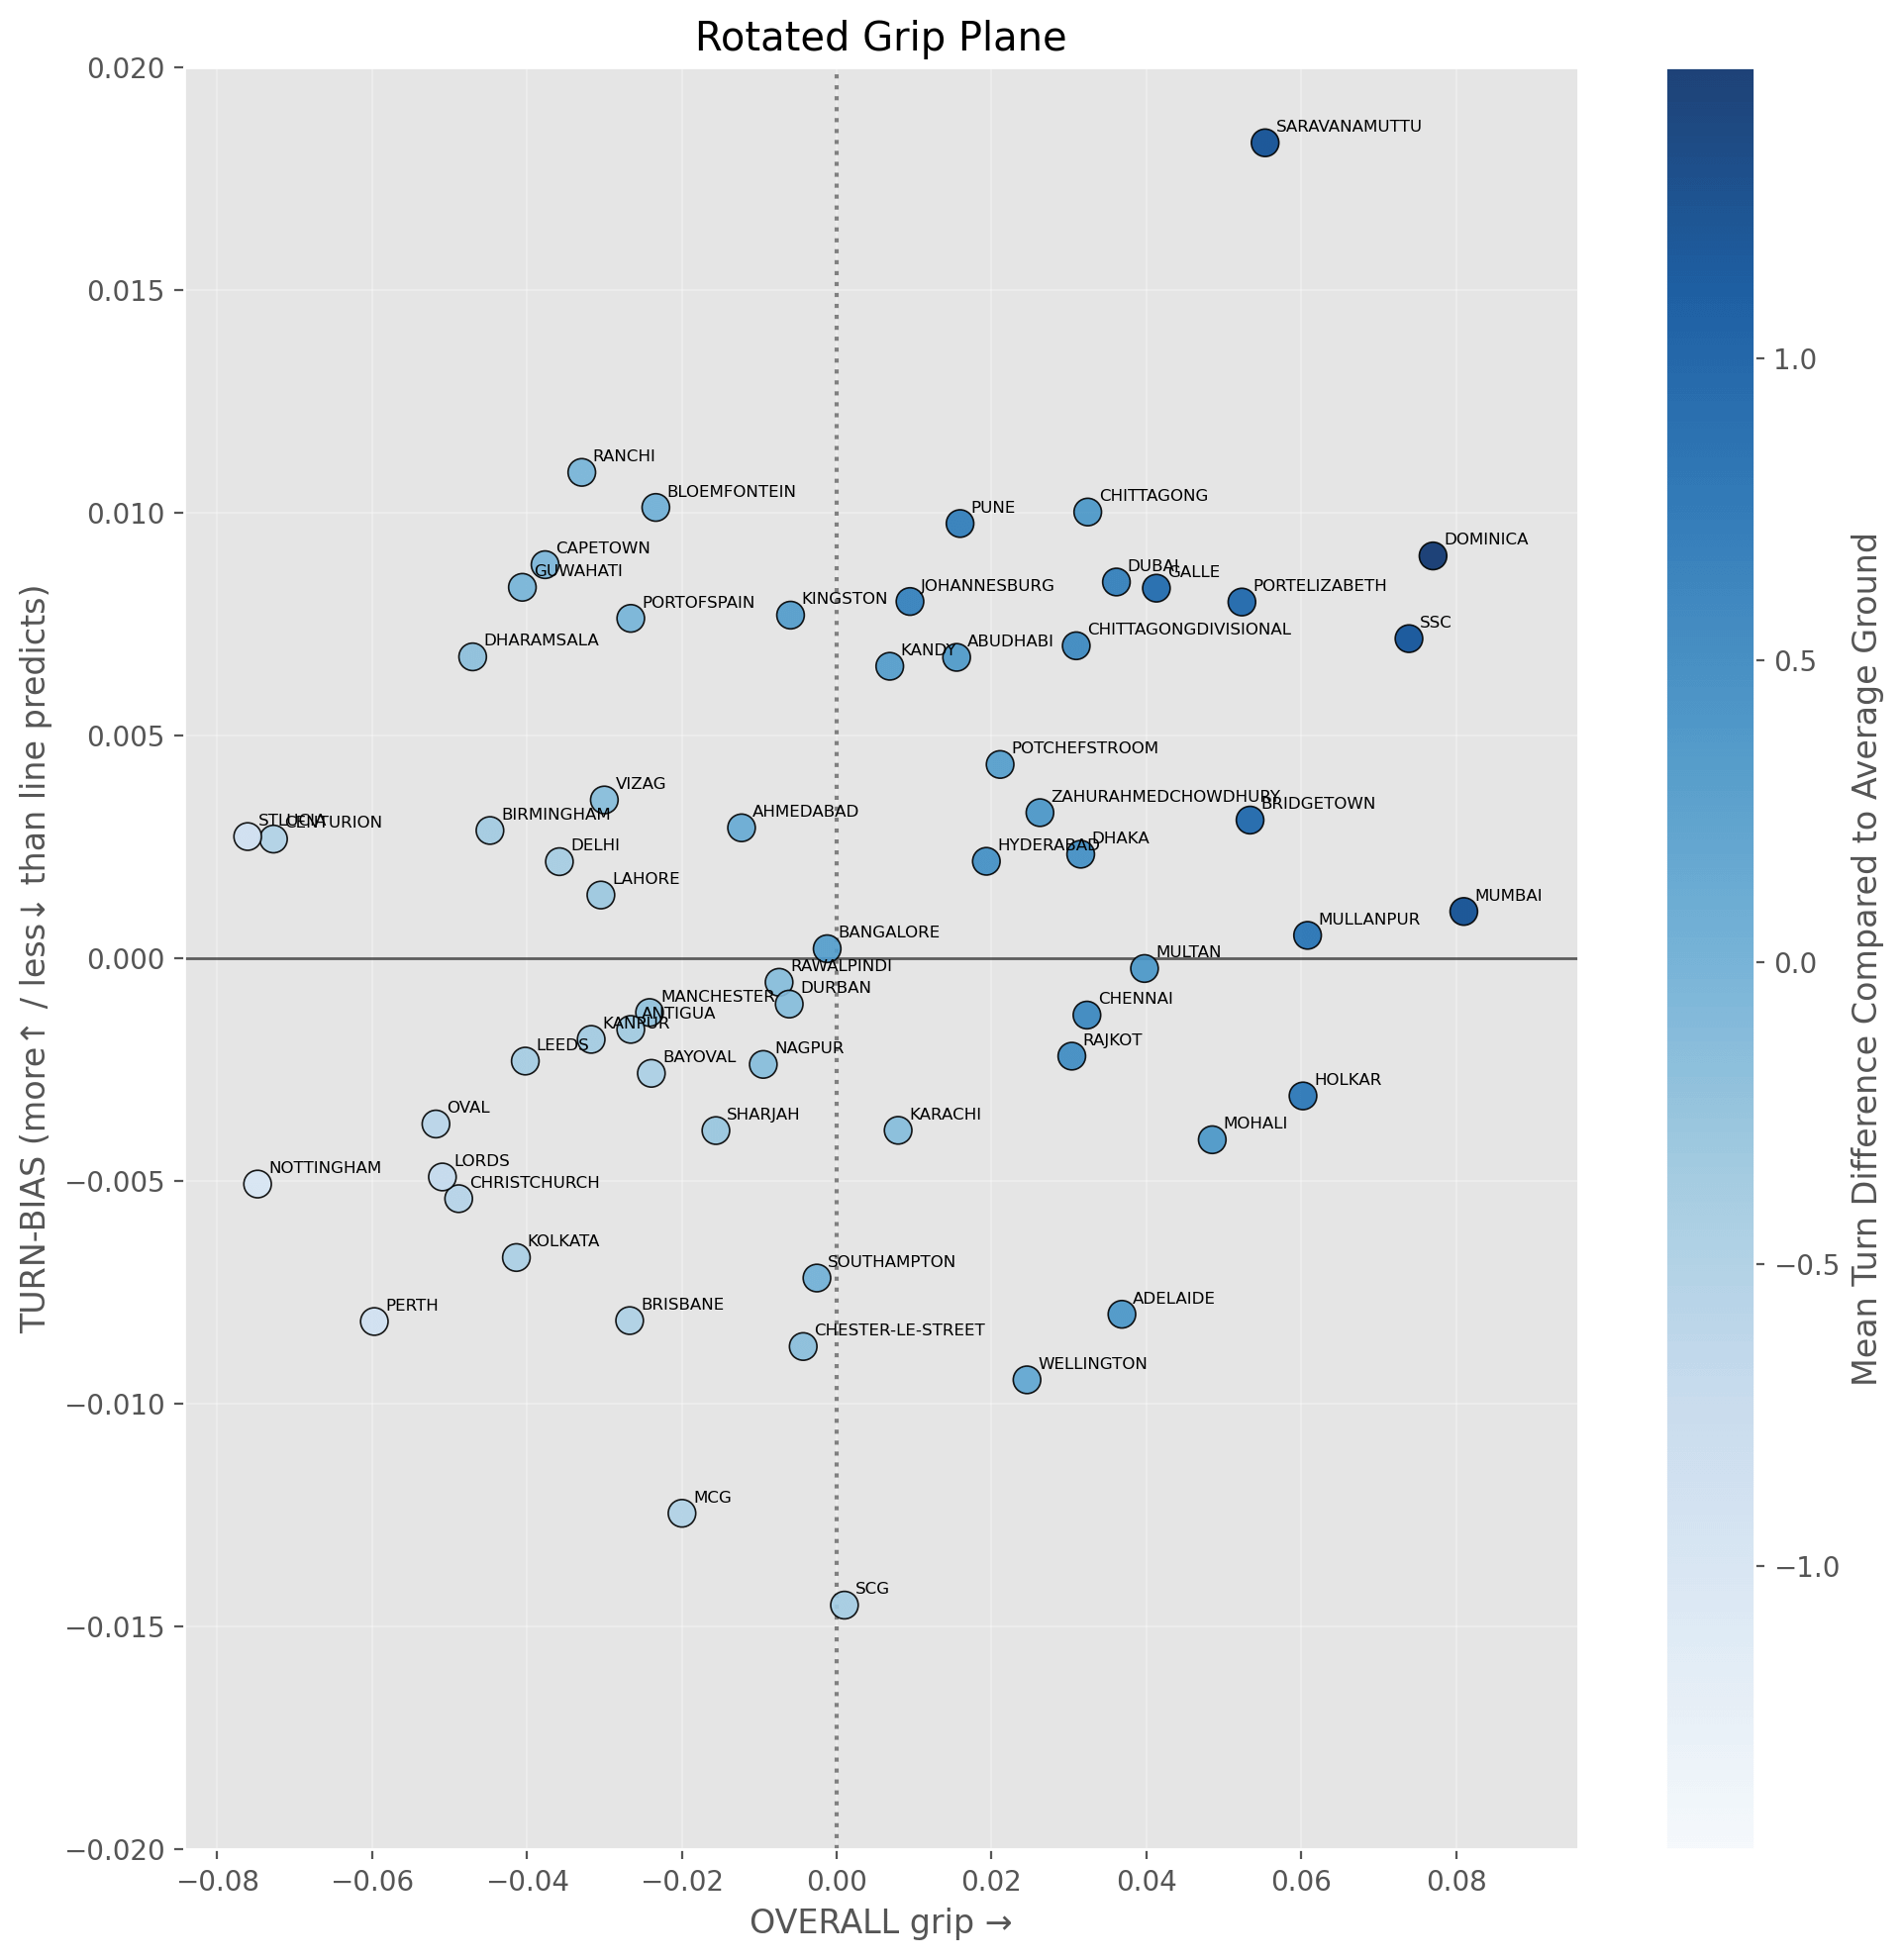
This plot confirms that turn is mostly a result of the overall grip of a surface (x-axis): the colour gradient goes from left to right in the plot. The y-axis presents an interesting decomposition, telling us the relative importance of the two mechanisms causing the turn. A higher-than-zero turn bias implies that sideways grip plays a significant role in the generation of turn on a pitch. This half of the plane has mostly WI and Asian pitches. The lower half, with negative turn bias, has pitches that rely on the robbing of forward pace for turn instead of sideways impulse. That does not mean that sideways impulse is the less dominant factor. Sideways pace is still dominant over line-impulse. However, the lower-half grounds see line impulse act significantly.
Perspectives
This was an unstructured wandering into the realm of pitches and how they spin. The idea was to connect the anecdotally known and discussed nature of pitches with respect to spin with some hard numbers. This is part of a broader research movement that seeks to codify the character of pitches using ball-tracking data to make rigorous connections between the two.
This methodology is by no means complete, but my hope is it will serve as a launchpad for more detailed studies into pitch character. One of the possible applications of this is to build a pitch rating system that runs live based on the fits done above, furnishing a “turn rank” as the match goes on, akin to PitchViz.
This is a great piece of analysis, it was really interesting breaking down the phenomenon of a turning ball into its parts. I had a couple of questions though.
1. Why did you not include revs on the ball in the model? I get that in the fixed effects you werew mainly dealing with trajectories, but I would think that revs would be an effect we would want to separate from the ground. Is it because that would be subsumed under the bowler's identity?
2. You say in reference to other factors that affect turn: "Ball condition: the state of the ball (new or old). We do not have any data for this." Why not inlcude the over number or nth ball in the innings as a variable for this? I think that would be an okay way to measure age of the ball.
It's too much!!